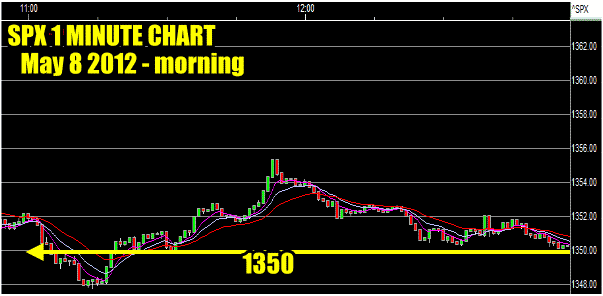
Market direction is sometimes easiest to spot by looking at the various market timing technical indicators and including at times volume. The volume this morning is increasing and the heatmap indicates how much selling is going on. The overall market direction trend is down for the time being. One of the most important indicators is the constant testing of support. The S&P 500 first line of support is at 1350. This morning during my SPY PUT trades the 1350 is being tested constantly.
While analysts may endeavor to convince investors that stocks are reasonably cheap here, they are in fact not and this has been the trouble for market direction since March. With the overall S&P trading at about 22 times price to earnings, this is above the normal range of around 15.7 times price to earnings. For stocks to remain at this level earnings from the S&P 500 companies much increase earnings each of the next 4 quarters and that is to just support today’s stock prices.
Why Price To Earnings Remains An Important Market Timing Indicator
While unemployment has been slow to fall in the US, businesses have done incredibly well. Historically low interest rates and slashed workforces have benefited companies to the best returns since 2006. As a benchmark earnings in 2011 hit a full 19% increase over 2010 which was also an excellent year. It is this increase in earnings that drives the Price to Earnings as stocks move higher to reflect these earnings. Historically however over the last 52 years the average share of profits from business to GDP has been 6%. In 2011 earnings to GDP averaged 9.8%. The number of times this has happened can be counted on one hand. As well the average return on equity from stocks is usually about 11% and in 2011 that figure was 15%. Price to earnings reflects all of this and while analysts continue to talk about how “cheap” stocks are, they are simply repeating what they have heard from others.
Very few investors or certainly television or “talk show stock pundits” understand Price To Earnings. For the present price to earnings as an average to remain at today’s levels, businesses will have to grow their earnings by at least 15% this year. Businesses are at the point where almost every cost saving measure has been put in place.
Headwinds Everywhere
There are a lot of headwinds for businesses to contend with. Europe is slowing as many countries are in recession and for most investors Europe looks like a basket case when it comes to handling their economic malaise. America despite what you may read to the contrary is the engine that drives the worlds economies. I read an article recently that indicated that Americans last year spent over 1 trillion dollars on insurance products and that is just one facet of American business. Imagine how much is spent on groceries, clothing, banking, housing. The economy of the US is so huge that even the entire continent of Europe is still smaller. People tend to not understand that practicarlly 25% of the all the world’s products pass through America.
In America unemployment at 8.1% cannot grow the economy fast enough. The saving rate in America which rose after the 2008 credit crisis has once more fallen off. Housing prices continued their decline last year and despite selective reports, overall housing remains a declining asset. China is working to improve living standards for many of its citizens including better housing. Many of the large Chinese mega-projects entered into after 2008 have been completed or terminated including their rapid rail system. For stocks to grow from these levels means even better profits from businesses than previously realized and 2011 was a amazing profit year.
Too Many Stocks Are Over-Valued A Sure Market Direction Changer
Not to sound bearish but many stocks are fairly valued and a too many are over valued as the drive for dividends in a zero interest rate envrionment has pushed up dividend payers with an influx of investors. Bonds yields are so poor that investors must decide whether it is worth risking bond capital loss for such low interest rate yields. Meanwhile dividend stocks have become the “new bonds” as it were. But dividend stocks are not bonds and have no co-relation other than paying a return.
When dividend stocks start falling many “new” investors to the dividend stock world will sell.
Market Direction This Morning and Support
Looking at the S&P 500 chart this morning (below) you can see the constant testing of the 1350 level.

My market direction morning chart for May 8 shows the continual testing of the 1350 level of support.
Market Direction Is Lower But How Low
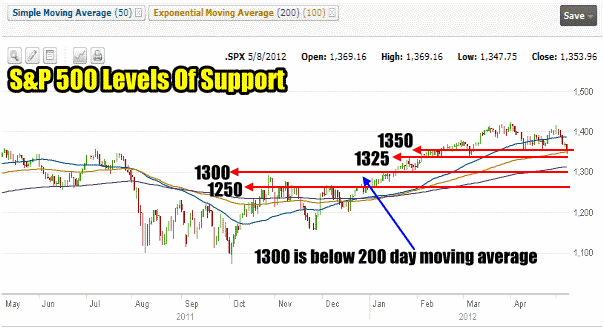
This continual testing will not last and the support level will break simply because investors who are interested in buying know that lower prices are on the horizon so why buy here. As they move lower the support will fall from 1350 on the S&P to 1325 and then 1300. If 1300 breaks on the S&P I believe we will see a full 10 percent correction from the high of 1419.50 reached March 27. That would put the S&P down around 1275 and bring the price to earnings ratio below 20 times earnings. I believe bargain hunters may start to look there. A 15% correction would see the S&P 500 down to 1200 and a price to earnings of just below 19 times.

Market direction is lower but how low? These are the support levels in the S&P 500. 1300 marks a decline below the 200 day moving average.
Market Direction Heatmap
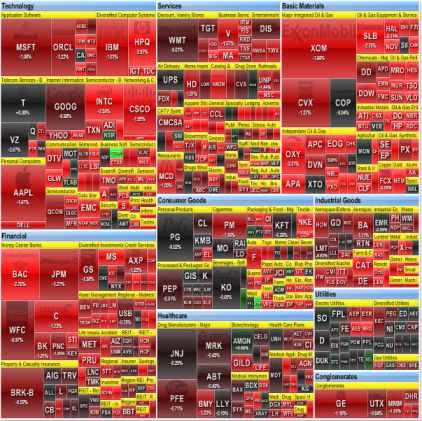
The heatmap below from vinviz.com which you can access from this market direction link shows how many stocks are presently under pressure this morning. While not unusual, if you take a moment and look at those stocks that were, in my opinion, too highly over-value such as Intel, Microsoft, Xom, and dozens more, the selling pressures are increasing in those stocks. This tells me that they were in fact over-valued and their percentage declines per day reflects how many investors were in these stocks earlier anticipating the types of higher prices analysts were bantering about. These same investors are now bailing out.

Market Direction Heatmap for May 8 taken at 11:30 AM
Market Direction Change Provides Other Opportunities
When stock market direction falls there is opportunity for profit on the way down and for buying stocks at lower prices for a move back up. I don’t believe this is 2008 all over again as companies are doing well but overvaluation is a problem and stocks must move lower to become fairly valued. I do believe there are enough warnings to advise that caution or as I point out the cautious bull strategy is worthy of consideration.
My Strategy Going Forward
Spy Put Hedge
As market direction continues lower, my strategy from here will be to play the short side as it develops through my spy put trade as I did this morning.
Put Selling
I will sell puts but only in small groups and only on the stocks I would own and at prices I would own them at. I plan to keep a fair amount of capital aside as I do believe there will be better opportunities as the month develops.
Rolling Down Covered Calls
It is worthwhile to consider rolling down covered calls on my long term stocks. This brings in a bit more income. I tend not to buy puts on my favorite stocks when market direction is down as I would rather keep rolling my covered calls lower and wait for the sign of the market direction move back up. At that point I then buy my covered calls back and wait to sell them as the market climbs. Last year rolling rolling covered calls lower as the market direction fell in early spring worked well and as it took until November for the market direction to turn back up, I had ample time to keep selling covered calls lower and finally buy them back when the market direction rose. This March I sold most covered call positions and I have now started to roll them down with the market direction.
Bounce Back Up – Selective Stock Picking
This being an election year may present some good opportunities as June and the early summer arrive to get into some stocks but I still think it will be for a short period.
Market Direction Should Be A Concern
The S&P 500 may end the year higher but for now I believe market direction remains lower before it can move back up and caution is in order.
