Market Direction today was bolstered by a drop in US Jobless claims of 41,000 to 410,000 and a ceasefire between Israel and Hamas. Meanwhile University of Michigan’s consumer confidence index came in below expectations with a reading of 82.7 falling from the previous 84.9. Still though 82.7 is still a great reading and shows that consumers will probably be spending again this Christmas which bodes well for stocks and overall market direction higher.
Apple Stock closed up fractionally at 561.70, but Intel Stock set another new 52 week low as investors remain worried about the semi-conductor industry and PC Sales in general. You can view my daily technical analysis of Intel Stock through this link. A number of other stocks that I follow had a good day including Microsoft Stock up almost 1%, YUM Stock up 1.57%, Nucor Stock up .87% and Canadian Banks rose across the board.
Market Timing Technical Indicators From Nov 21 2012
This year my market timing technical indicators have been quite accurate. To date since Jan 3 2012, the market timing technicals have given correct calls on market direction 78% of the time. This is excellent and has certainly assisted my Put Selling strategies.

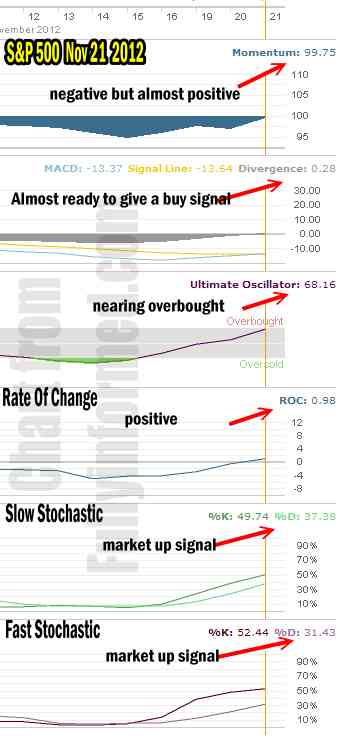
Market Direction is turning back up as confirmed by market timing technical indicators.
For Momentum I am using the 10 period. Momentum is on the verge of turning positive. It has now climbed back from solidly bearish readings and it set to advance into positive territory on Friday.
For MACD Histogram I am using the Fast Points set at 13, Slow Points at 26 and Smoothing at 9. MACD (Moving Averages Convergence / Divergence) is still negative but is ready to turn positive and possibly issue a buy signal on Friday.
The Ultimate Oscillator settings are Period 1 is 5, Period 2 is 10, Period 3 is 15, Factor 1 is 4, Factor 2 is 2 and Factor 3 is 1. These are not the default settings but are the settings I use with the S&P 500 chart set for 1 to 3 months.
The Ultimate Oscillator moved up big today. It is on the verge of signaling overbought.
Rate Of Change is set for a 10 period. Rate Of Change is back positive.
For the Slow Stochastic I use the K period of 14 and D period of 3. The Slow Stochastic is once more signaling that the market direction is still higher.
For the Fast Stochastic I use the K period of 20 and D period of 5. These are not default settings but settings I set for the 1 to 3 month S&P 500 chart when it is set for daily. The Fast Stochastic is also signaling that market direction will continue higher on Friday.
Market Timing Technical Outlook Consensus
The overall key is MACD. When it turns positive then the market direction will be confirmed as up. Right now though everything looks ready to move higher on Friday although it is a short day. What is interesting about the technical timing tools is that Slow Stochastic tries to predict a trend longer than a single day. Right now it is predicting that there is more upside left which should last into next week.
Market Direction Is No Longer Oversold
The market direction is no longer oversold. All indicators have left oversold readings earlier this week and if buying continues, we should shortly see some give back in the market as it is reaching overbought territory.
Market Direction Chart Of S&P 500
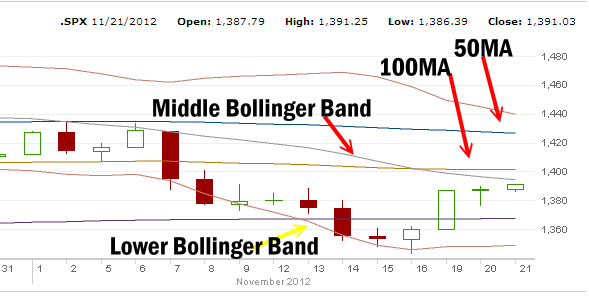
Below is the latest Market Direction chart for the S&P 500 Stock Market Index.Ttoday’s push higher in market direction is almost ready to cross the Middle Bollinger Band. I am expecting some weakness at the 100 period moving average and a possible little pullback but the real action should come when this rally reached for the 60 period moving average. At that point I am expecting to be using Spy Put Options again as I think the market could have trouble getting through the 50 period Moving Average.

Market Direction Chart for Nov 21 2012 on the S&P 500
Meanwhile, the S&P 500 market direction has moved solidly away from the Lower Bollinger Band which is a bullish sign.
NASDAQ Market Direction
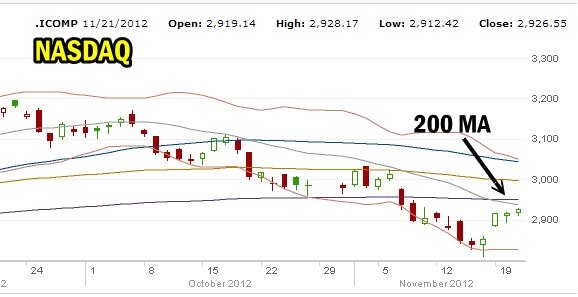
The NASDAQ has been following the same pattern as the S&P 500 except from a lower point. But just like the S&P 500, the NASDAQ has pulled away from the Lower Bollinger Band and is preparing to the cross up and over the 200 period moving average.

Market Direction on the NASDAQ as of nov 21 2012
Dow Jones Market Direction
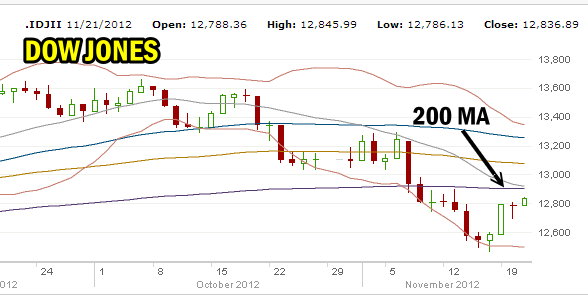
The Dow Jones is a carbon copy of the NASDAQ as it too prepares to cross back over the 200 period moving average.

Dow Jones Market Direction Nov 21 2012
Market Direction Outlook And Strategy For Friday Nov 23 2012
Everything continues to point to a market direction moving higher. Even the news out of Europe regarding the never-ending problems with Greece, failed to dampen enthusiasm from investors. These are all good signs. The test will come with the first pullback. If that pullback is short and sweet and sets a higher low, then the markets need to set another new higher high. It seems trivial to a lot of investors but technically these steps in rebuilding confidence are needed if the stock markets are to recover and send market direction higher.
I noted that Williams stayed the course yesterday with his Market Direction Portfolio and he pulled his stop yesterday when the Dow started to fall with Bernanke’s comments about the Fed and their inability to assist the fiscal cliff dilemma. He put his stop back on and today has adjusted it again. His market direction portfolio certainly is working well. If he cashed out today he would have earned 10% since starting on September 4. There are always strategies out there that suit different types of investors. William likes his market direction portfolio because it requires very little work, no research on stocks, and basically just follows the market using two indicators which he can check nightly. For FullyInformed Members, make sure you check out his comments from today.
Market Direction Outlook for Friday then is a continuation of this rally. Enjoy your Thanksgiving.
