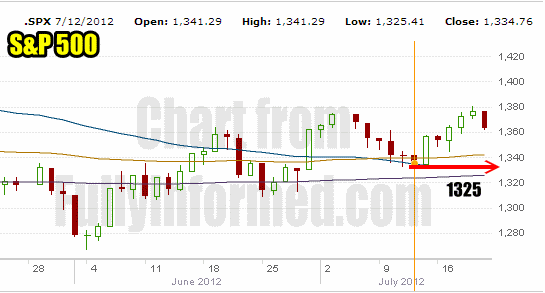
Market Direction on Friday was looking for a reason to pull back after an overbought condition. Presently the Market Direction remains up but I would expect more selling at the start of the week. What I am watching is whether the recent low of 1325 is breached. I explained last week that the market direction for a few weeks now has been of higher highs and higher lows. As long as that trend continues the market direction up remains intact. But if the latest low, which is 1325 is broken then it will mark the end of the recent rally. This week I will be watching the market direction and that low.
S&P 500 Chart For Market Direction
The higher highs and higher lows since the start of June are obvious in the chart below. While the mid-term market direction is still range bound, the market direction remains up as long as this pattern continues. This marks a pivotal week for the S&P.

Market Timing To Start The Week
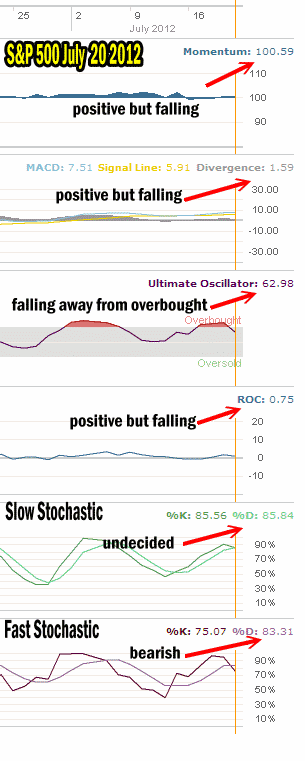
Friday’s action was not enough to push any indicator except the Fast Stochastic into a bearish stance. But the Fast Stochastic is the most important market timing tool for short-term market direction, so I would expect more selling on Monday or Tuesday.
The remaining market timing indicators as you can see have pulled back from Thursday’s higher readings. The Ultimate Oscillator has pulled back from overbought. Meanwhile the Slow Stochastic indicator is undecided. Since the Slow Stochastic looks out beyond a couple of days, we could see the S&P pull back as per the Fast Stochastic and the stay sideways as per the Slow Stochastic.

Market Timing Indicators are mostly positive but falling.
Market Direction Summary
It should be an interesting week for the S&P. As long as the market holds and fails to break the previous low the market direction up remains intact. Right now market timing indicators are primarily positive but Friday turned all of them lower. We will have to wait and see what the market direction does for the next couple of days and then reassess.
