Yesterday’s market timing indicators general consensus was market direction down. While I certainly did not expect such a large sell off which emerged as the day progressed, the market timing indicators for short-term outlook certainly were explicit. In a number of recent articles I have mentioned how it is only going to take some bad news to pull the market down and market direction was very overbought. So how much damage did the selling today produce? In my opinion without even looking at my market timing indicators, it signalled another leg back down. When the stock markets sells this heavily in one day, normally there will be a rally and then the market will retest the lows. Often it will retest the lows several times.
Understanding Market Direction By Historic Patterns
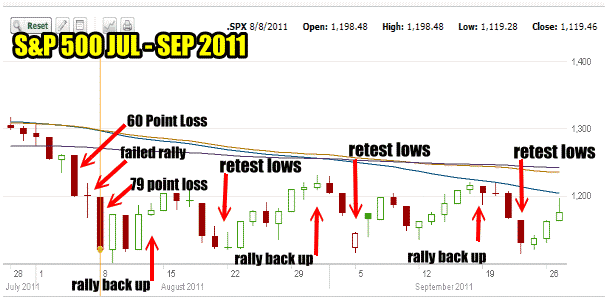
For example, below is the major selloff in August of last year. On Thursday August 4 2011 the S&P lost 60 points or 4.7%. The next day Friday August 5, saw a failed bounce and then another decline on Monday August 8 of 79 points or 6.5%. Basically the S&P lost 11% in three days. The market direction changed and a rally ensued but was short-lived and the market again testes the August 8 lows. More rallies occurred but the market direction could not change and the S&P 500 kept retesting the August 8 lows until they broke in October 2011.

The above S&P 500 Stock Charts shows what is typical of a selloff. One big down day, a failed rally and a second big down day. I would expect this pattern for tomorrow. Then a rally and a retest.
Today’s Market Sell Off
Today’s market sell off was a combination of bad news on the economic front from the Philly Fed where analysts had expected -5.5% reading but got a dismal -16.6% reading and no new money from the Fed. Why investors thought Bernanke was going to pump trillions more into the economy at this point I do not know, but I felt once reality set in they would realize stocks are expensive and sell out. As a put seller, this is exactly what I want.

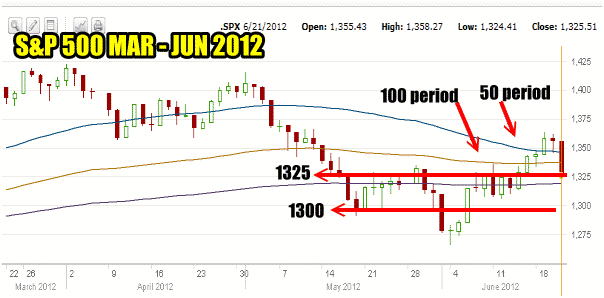
Market Direction Chart For The Ongoing Correction. The 1300 level is an important support zone. The chance of it breaking this time is higher than previous. Today's selloff placed the S&P back to 1325 below both the 50 and 100 day moving averages.
Stocks Are Overvalued
I have repeatedly indicated in many articles that many stocks at the present level are overvalued. I have received a lot of emails telling me this is not the case but honestly, many stocks are overvalued particularly looking forward. Analysts are pushing various stocks like drug dealers and I am convinced it is because they have clients in these stocks are elevated levels. The game has always been to push stocks higher and dump the shares on someone else and often that someone else are retail investors, the little investor. But this time a lot of little investors are staying on the sidelines and there remains no conviction among many investors to get into this market, particularly at this level. As one investor told me, “I didn’t get back into the market in 2009, 2010 or 2011, so why would I buy in now?”
Where Is Market Direction Headed
Right now the S&P 500 is back below the 50 day and 100 day. Today’s 30 point decline or 2.23% is on par with June 1 2012 32 point decline which was a loss of 2.4%. A lot of analysts and investors felt that the 1266 low of June 4 marked the end of the recent correction. I had indicated that the market must break through and hold above the 50 day to end this correction. This pullback below the 100 day could eventually see the S&P 500 retest the 1266 level.
This Is Not A One Day Plunge
I do not believe this is a one day plunge. A smaller number of analysts had pointed out that this latest rally had all the markings of a bear trap and perhaps they may be right. We will probably try a little rally tomorrow and then I would expect more selling next week. I imagine the S&P 500 will fall quickly to 1300 and test support there. If support breaks and I do believe it will, the market direction will push lower and perhaps retest 1266. It is important to remember that the last rally from that lows was marked by repeated analysts articles and interviews extolling how the Fed will now, “finally” step in and rescue the economy. Stocks are on a high of Fed intervention and at some point this will end badly. Being an election year I don’t think it will be this year, but who knows what next year might bring.
It’s Still About The Economy
The US economy is lumbering along at a snail’s pace and with the developed world heavily stuck in debt, spending their way out of slow growth is just not possible. Yet I read articles almost daily talking about how stats are better than most believe and the US economy is going to get better in the fall and unemployment is still better now than 4 years ago. But the truth is stocks are at elevated levels based on continual Fed intervention. Analysts every day push dividend stocks like the answer to a retirement dream. They talk endless about dividend paying stocks as if they are guaranteed investments. Interest in dividend investing is at an all time high as the Fed has done everything possible to push short-term and longer term rates down to the point where saving your money makes no sense. Ben Bernanke is a student of the Great Depression and has studied it inside and out. He and many others believe the problem was lack of spending. What better way to push people to spend than to make it worthless to save. Investors with a million dollars complain they can’t earn more than $10,000 in interest in a year and have to pay tax on it. You can look through rosy glasses as much as you want, but the US economy is only limping along and it is not generating enough jobs. It remains questionable if there is a floor under housing yet. Into this picture arrives Europe and its mess. Congress continues to argue over budget cuts because 20 years of over spending is a habit that is hard to break.
All of these issues mean volatility will climb which means put selling and naked calls will be profitable if done safely and carefully in a consistent fashion.
Staying With The Cautious Bull Strategy
I do not believe the bull market is dead until the Fed stops tinkering. But until then I do believe strongly that the cautious bull strategy is a great choice and certainly my choice. To summarize the cautious bull strategy sells puts in weakness and buys them back in strength. The same can be done with naked calls. It does not hold anything for any lengthy period of time and stays with big cap dividend paying stocks only. I am aiming for only small profits and continuing to hedge with my spy puts.
Traders Almanac Prediction
The Traders Almanac prediction for this week was the Dow down 12 years in a row and 19 of the last 21 years the average loss for this week was 1.3%. In my market timing column for Thursday last week I mentioned the outlook for this week could be nasty. Next week marks the last week for June and it has been bearish in 15 of the last 20 years for the Dow. Interestingly it has been bullish for the NASDAQ which has been up in 12 of the last 19 years but down in the last 6 years so personally I think the last 6 years speaks volumes.
Market Timing Indicators For Market Direction Outlook As Of Close June 21 2012
My market timing indicators reflect today’s market direction continuing turn to the downside.
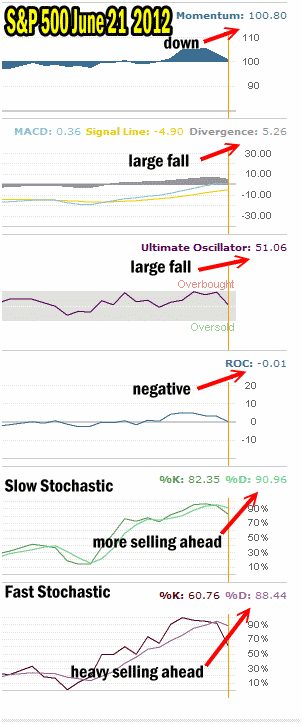
Momentum continues yesterday’s fall and today is clinging to remain positive with a reading of 100.80.
MACD which has signalled this rally from day one has today fallen from 7.11 to 5.26 reflecting the heavy selling. One more heavy selling day and it will signal a market direction down call.
The Ultimate Oscillator at 51.06 is also clinging to remain positive. This is a big drop from overbought where yesterday’s reading was 68.33.
Rate of Change which yesterday was positive is now turned negative with a reading of -0.01.
Again, the most informative of the market timing indicators right now, regarding market direction are the stochastic indicators. The slow stochastic is reading %K 82.35 and %D 90.96. This extremely overbought reading has turned more negative than yesterday’s signal down call. As the slow stochastic looks out beyond a day or two, it is telling investors that more selling will be seen next week and market direction will continue lower.
The Fast Stochastic shows the pronounced drop, and is now reading %K 60.76 and %D 88.44 which confirms yesterday’s market direction down signal and is now saying that market direction will continue lower, short-term.

Market timing indicators for June 21 2012 signals market direction down
Not All Doom And Gloom – McClellan Oscillator
Everything is not all doom and gloom. The McClellan Oscillator flashed an all clear on June 20 which for those who follow the indicators usually means a selloff in equities and then a resumption of the uptrend. Normally the selloff has been between 2% to 3%. So for those who like this long term indicator, things look pretty good. For myself I prefer my short-term market timing indicators to tell me what market direction to expect.
Market Direction Summary For June 21 2012 Based On Market Timing Indicators
Market direction may try to rally on Friday based on historic patterns and based on the heavy selling from today. As well with the Momentum, Rate of Change and Ultimate Oscillator still hanging on before turning negative and with MACD still positive these all point to a rally attempt for tomorrow. But the rally will almost always fail and for interested investors is probably an opportunity to sell covered calls or naked calls to bring in some income and buy into bear funds such as HDGE or SDS for the next leg down.
The Stochastics are the best indicators at this point and they have been correct since the rally started. Right now both are confirming yesterday’s market direction down signal and both are indicating that the market direction will continue lower into next week.
It is important to remember that the major down signal from April 4 from the MACD Histogram has not been broken and the intermediate trend remains down. The above market timing indicators are for short-term market direction and the inability of the S&P 500 to break and hold the 50 day (period) moving average is a signal of another leg back down in this correction.
