Interesting how quickly the mood changes along with market direction. Today the selling continued throughout the day and bulls stood back and let stocks continue to fall. The market direction today was down making the IWM Trading For Pennies Trades decent as well as the SPY PUT trades. Just a few days of selling and the Dow Jones and The S&P 500 are both on the brink of breaking their 50 day moving averages. If this happens then the chance of recovering the previous highs will be difficult for a while. Analysts are split as to whether this is just a normal correction in an ongoing bull that promises to break into new 5 year highs within a couple of weeks or whether indeed the market will correct deeper and pull back perhaps as much as 6 to 8 percent before the selling abates. If the VIX is to be believed then there is nothing much to worry about as it hardly moved, closing at just 16.29. So according to the VIX the recent selling is nothing to be concerned over.
Let’s review some charts and that should help make the market direction decision a lot easier.
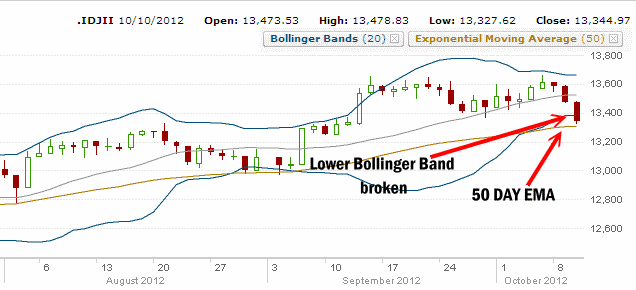
Market Direction Dow Jones Chart For Oct 10 2012
The Dow Jones broke through the Lower Bollinger Band today and is preparing to breach the 50 period moving average. The break of the Lower Bollinger Band should be followed by a bounce. If it doesn’t then either it will continue to hug the Lower Bollinger Band and move lower or it will trend away from the Lower Bollinger Band. If it trends away for more than a few trading sessions then the likelihood of it moving lower increases each day. Right now though as we can see the Dow Jones is down just 2.3% from the Oct 5 high of 13661.87.
MACD though on September 26 gave a sell signal on the DOW and did not confirm the Oct 5 high but instead remained negative. On the Dow is it presently decidedly negative.
Market Direction chart on the Dow Jones Index
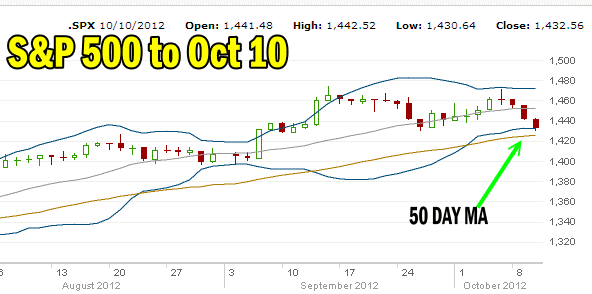
Market Direction S&P 500 Chart For Oct 10 2012
The market direction chart for the S&P 500 shows how close the market is to breaking the 50 day moving average.
Market Direction Chart for the S&P 500 Oct 10 2012
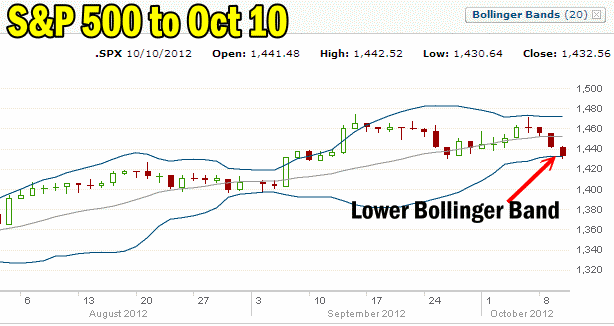
Market Direction S&P 500 Chart Bollinger Band
The Bollinger Band chart on the S&P 500 shows the market is today sitting on the Lower Bollinger Band and like the Dow Jones, I would expect to see a bounce from here. No bounce then in market direction would mean the market would cling to the Lower Bollinger Band and continue to slide or move away from the Lower Bollinger Band and trend sideways. The same technical picture would emerge if the S&P stayed trending sideways for too long. Normally if the S&P doesn’t recover the previous high it will move lower after trending sideways for a few trading sessions.
Market Direction Bollinger Band Chart
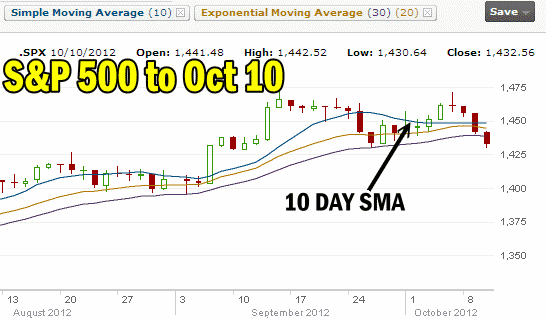
Market Direction S&P 500 10 – 20 – 30 Moving Averages Strategy
The 10 – 20 – 30 moving averages strategy while a simple strategy does, as regular readers know, hold some credibility as to market direction. Today the S&P 500 shows that the 10 day or period moving average has not crossed the 20 or 30 EMA. If selling resumes tomorrow then the 10 day will cross which confirms the market is going to move lower before attempting a recovery.
Market Direction chart studying the 10 - 20 -30 moving averages strategy
Market Direction S&P 500 – At The Breaking Point
Another excellent method of determining market direction is looking at the previous lows. The S&P today hit a low of 1430.64 before closing at 1433.32. If the S&P falls below 1430, it will have broken the higher lows of the rally that started the first week of June. If that is the case then the rally may indeed be at an end for a while.
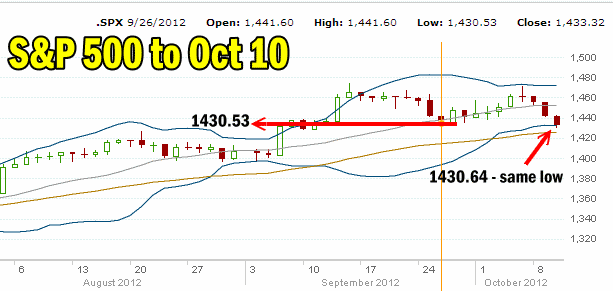
Market Direction chart tracing the lows of the recent rally
Market Direction And Presidential Elections
The weeks leading up to Presidential Elections can be very unfriendly to the stock markets. This has been the case in numerous elections over the past 14 years. Investors hate uncertainty and while investors may have rallied over last week’s television debate, if anything, the debate just added more uncertainty to an already worried market.
Market Timing Technical Indicators
Finally, let’s look at the close of the market today to see what it can predict about tomorrow’s market direction.
Surprisingly, momentum is unchanged which could be a good sign for tomorrow. It shows that while the market did pull back today, there was not a lot of concern on the part of investors.
MACD which issued a sell signal on September 25, is still falling.
The Ultimate Oscillator had a big fall today and is now close to oversold, but there is still room to fall before reaching extremely oversold.
Rate Of Change is negative which is to be expected after two heavy declines.
The Slow Stochastic with a reading of K period 31.60 is into oversold but with D period at 53.57 there is still room for more downside.
Finally the Fast Stochastic is extremely oversold with a K period of 4.62 which signals to investors that a bounce is about to happen. However the D period at 45.97 may contain much bounce.

Market Timing Indicators for Oct 10 2012
Market Direction Outlook For Oct 11 2012
With the market timing indicators continuing to show bearish sentiment any bounce could be short. However it is important to also remember that at this stage of the present bull market we are sitting at highs not seen since late 2007 and there is bound to be nervousness among investors. Any bad news will have some investors taking profits and raising cash for that “just in case” scenario. No market can keep climbing without back testing and building a base to push higher from.
Right now our market direction attention should be focused on:
A) The 50 day moving average. If market direction breaks the 50 day then it is worth taking some profits and raising a bit of cash. That has to be the first item to watch.
B) The market direction bounce back. If it is weak and actually trends more sideways than up, then that too is a sign to raise some cash.
C) The most recent low. If the S&P breaks through 1430 then the string of higher lows in market direction has been broken. If it does not recover the latest market direction high on any rally then the string of higher highs is broken. That will mark a downturn in market direction that could test the 200 day moving average.
The market direction outlook for Thursday is for a possible try at a bounce but it probably won’t close at the highs as the day closes tomorrow. The signals are fairly bearish and if MACD cannot turn back then the Sept 25 market down signal will be confirmed and market direction will move lower.
