Market Direction is always a difficult guess and I do believe it is a guess. Today’s action though is beginning to show that either the overbought condition is beginning to tell or in fact the market is perhaps putting in a topping action from the recent run up in the market.
Today’s chart ties in well with yesterday’s. While I am not expecting any big down or big up move in market direction, the market could be telling us that the recent run up is out of steam. In fact many stocks are back in what I would consider over valued territory. Stocks like McDonalds (MCD) which today reached a high of $91.20 and is trading at 18.26 times earnings. But McDonalds is not alone. There are many stocks that are overvalued again. Yum brands is back to $54.37 and trading at 21.83 times earnings. Coca Cola set a new high today at $70.77.
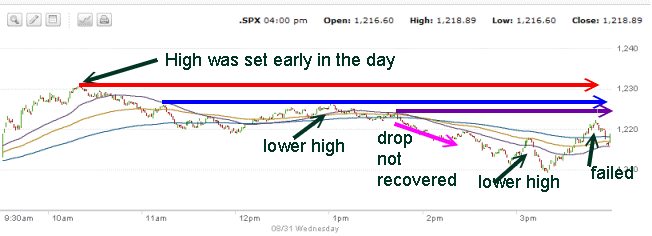
Let’s look at today’s action and see if we can figure out the next move in market direction. Early in the day the high was set and from there the market drifted lower. There were a few rallies but each one set a lower high. Around 1:30 pm the S&P moved lower and went negative. The rally failed and the market again went lower. The late day rally failed to reach any of the three highs of the day.
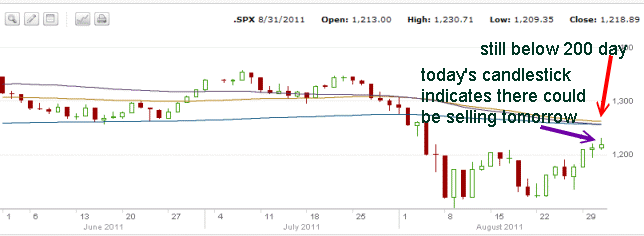
The chart below looks at the summer months, June, July and August. Even with the terrific rally from the recent low, the market is still below the 200 day moving average. Today’s candlestick indicates there could be selling tomorrow as the market closed near the lows of the day.
Market Direction – Buying The Dips
The action for the past few trading sessions has been for the dips to be bought and then the market pushed higher, but with computer generated trading, accounting for over 70% of the recent volume according to the S&P, the profits will not be as great as expected by their algorithms and this could also be the reason for the drag in the market over the past 2 trading sessions. Computer trading requires retail or institutional investors to join in at some stage and many investors are out of the market for now.
An overbought indicator remains on the market and this could also be the reason for the market to be lagging. In fact overbought conditions, just like oversold, can last far longer than investors have patience. I had thought the market might strive to reach the 1260 level by now and then try to hold for a few weeks. But the recent action is anything but bullish.
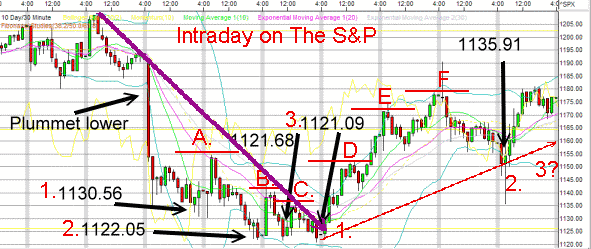
While I do not expect any great selling at this point and I do not have any SPY Puts in place to take advantage of a downturn, I must remind myself of my chart of August 26 which is below. In that chart I pointed out that there would be a third move lower which should be higher than 1135.91. This move would indicate that the market overall will move higher. If the market though, pulls back and sets a low that is lower that 1135.91 than this continues to confirm that the bear market is indeed in charge and market direction is down.
Market Direction – What I Am Presently Doing
So what am I doing as an investor? For those stock that I sell covered calls on I am selling deep in the money covered calls. For those stocks that I sell puts on I am selling deep out of the money puts. In this manner I can continue to generate income and stay in the market will higher levels of protection than normal.
Market Direction on the S&P is now at the crossroads.


