I read another article this morning pointing out that the GDP is only an anemic 1.5% and market direction should be a lot lower. Yet the market direction yesterday set a new four-year high intra-day high. I read a second article which told investors that the stock market is putting in a second top right now and investors are going to be pummeled this September when market direction breaks to the downside. It is an understatement to say that a double top here would be tough on stocks. Finally a third article I read was about noted analyst Jim Rogers and how he and other “experts” have spotted a “frightening pattern” which is going to lead to a massive economic catastrophe unlike anything ever seen in the history of the world. Apparently, according to the article, Rogers and his team of experts have presented their findings to the UN, UK and other governments. They claim this economic catastrophe will start right after the Presidential elections. Rogers has been a critic of Quantitative Easing and claims the world is drowning in debt. Obvious Rogers believes market direction is going to head down later this fall.
Market Direction And Pundits
I do not know who the other experts are with Mr Rogers but I would like to point out that I also read an article recently that commented on his no economist had ever been right in the past couple of hundred years. I recall Richard Nixon leaving the gold standard and economists explained through hundreds of charts and in every newspaper available that the US would collapse within a year. Didn’t happen. Just recently economists warned that the Euro only had 3 weeks left before a financial Armageddon of shocking proportions was going to hit Europe. Didn’t happen. Instead the market direction turned around and has continued higher ever since.
Since starting to invest in the early 1970’s I have read and heard just about everything you can imagine was going to happen to stocks. I recall Robert Prechter’s dire predictions in the 1980’s, 1990’s and the last 10 years of super cycle bear markets and more, yet here we are back reaching to try to challenge the all time highs of 2007.
This Is Why I Do Put Selling
This is why I do Put Selling. I can use my market timing indicators to try to gauge market direction, but overall it is a prediction certainly not science. Through some of the worst markets I have stayed the course and continued Put Selling among a handful of large cap dividend paying stocks. I have done the same through some of the best markets. Today for example I did more Put Selling against Intel Stock.
Instead of listening to analysts and pundits who are totally confounded by the market direction, I follow the market direction trend and that trend presently is higher. If a market top is being put in place we will know soon enough and then I will be, guess what, Put Selling that trend lower.
Put Selling does an excellent job of staying with the trend, profiting from the trend and when the trend changes, profiting from that change in trend.
Market Timing Technical Indicators
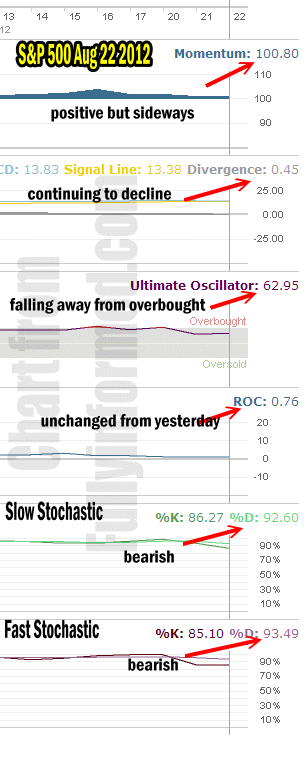
My market timing indicators are certainly following the trend today. Momentum is positive but moving sideways which is similar to the market direction. MACD is declining and despite the market recovering from the daily selloffs, MACD is not reflecting the strength in the market.
The Ultimate Oscillator is falling away from an overbought position but it is still quite positive.
Rate Of Change is unchanged from yesterday and remains positive.
Both the Slow Stochastic and Fast Stochastic are bearish, indicating that the market is going to move lower over the next several days.

market timing indicators are turning sideways to down
The general consensus then is for the market to remain bearish to sideways. There are no indicators pointing to the market direction as moving higher. While the bearish readings from the stochastic indicators is advising that more Put Selling opportunities may lie ahead as stocks stay weak here, it is the fact that no indicators are bullish that is the better indicator of market direction at this point.
Market Direction Summary for August 22 2012
While stock market pundits seem perplexed over the continued strength in the market direction, today’s market timing indicators while turning bearish to sideways in their readings, do not show any indication of a severe market pullback.
Instead the market timing indicators show that there is not enough strength in the market to push to new all time highs presently, but that could change once this period of weakness in market direction ends.
