Market Direction is the single most important element in investing. Ask any investor who bought stocks at the market direction top in 1999 to 2000 or in 2007. Investors who bailed out of stocks in 2001 through 2003 and again in 2008 to 2009 racked up billions in losses. Yet today with the ECB announcing a program to buy and “sterilize” one to three-year bonds from countries experiencing serious liquidity issues, the S&P is rocketing to new 52 week highs, having erased the entire 10% decline from the April highs.
Despite all the doom and gloom since April this has actually been a bull market correction after a run up of over 20% from the fall of 2011.
Market Direction Is About Perspective
I have over the past months received hundreds of emails from investors concerned over the state of their finances and in particular the recovery of the S&P 500. It is interesting how many are worried about the stock market and even more concerned about how to invest in the stock markets today.
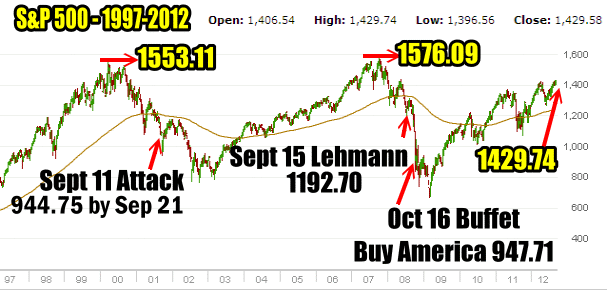
Investing in risky assets like stocks is all about keeping a realistic perspective on Market Direction. The market direction chart for the S&P 500 since 1997 is below. I keep a trader’s journal that contains hundreds of charts about the market direction and about the stocks I invest my capital in.
The chart below is from that journal. By looking at this chart I can keep a perspective on what is happening in the stock market and how to approach my investing method which consists primarily of selling puts.
Market Direction and Doom and Gloom
I believe a lot of investors anxiety stems from not having historical evidence to fall back on. Investors should keep charts. For example in March 2000, the S&P 500 set an all time high of 1553.11. At that time the S&P 500 was trading at much higher multiples than today. Indeed the NASDAQ was trading at Profit to Earnings multiples that should have made any investor wonder about the sanity of buying stocks. It was a buying frenzy, which is not a time to be buying stocks, although the majority of investors were buying stocks. It was however a moment in time when doom and gloom was hard to find. That should have been a warning to a lot of investors.
Stocks began a pullback which actually did not end until into 2003. Every bear markets has pivotal moments. The Sept 11 2001 terrorist attacks was the pivotal moment for that bear market. When the stock markets opened for trading a few days later, the S&P hit 944.75 by Sept 21 2001 before rallying. I suspected there was more downside ahead but doom and gloom pervaded as fear gripped many stock investors.
At 944.75 the S&P was trading at Price to Earnings multiples of below 10. Many quality companies were trading at multiples below 8. I put much of my capital to work at the 940 level in the S&P. I ended up with a lot of in the money naked puts as many stocks continued to fall. The strategy was simple even in that bear market. Roll the put options while waiting for stocks to recover. I then put what capital I had left and was earning, into stocks as they fell even further. That meant selling puts further out of the money while holding many puts in the money.

The S&P 500 market direction chart since 1997
Market Direction Collapse Of 2008
Following the bear market of 2000 to 2003, the stock markets recovered and in 2007 set a new all time high of 1576.09. Again the Price To Earnings ratios were high as in general the S&P 500 was trading with multiples over 15 times. The pullback that commenced also its pivotal moments. The credit crisis reached the forefront on Sept 15 2008 with the largest bankruptcy in US History when Lehmann Brothers collapsed. The S&P was at 1192.70 that day and the plummet that followed was met by a proclamation by Warren Buffettt on Oct 16 that he was buying America. On that day the S&P was at 947.71, almost the same level as September 21 2001.
This was because stocks were very undervalued. That does not mean stocks could not fall further, but it did mean there was value in stocks. After Sept 15 2008 doom and gloom filled the airwaves and media. By the time Buffettt made his buying America article public, I was back Put Selling. Just as in 2001, the market moved lower into 2009 and eventually I ended up owning shares in some terrific companies at very good prices.
This is the great thing about Put Selling in a severe bear market. You can eventually own some great companies at rock bottom prices, but it takes a lot of fortitude to sell puts when stocks are tanking. The key is to keep some capital back which not only allows you to sleep nights, but can assist in picking up stocks if they move even lower, which they almost always do.
Why Use A Market Direction Chart
The market direction chart for the S&P 500 was what I referred to, to keep my perspective while the media was calling for the end of the world. Indeed gun shops sold more guns in the fall of 2008 than at any other time in the previous 20 years. While the media felt a depression more destructive than the Great Depression was about to occur, Buffett was back buying stocks.
The most important aspect for keeping a market direction chart such as above is a reminder of where the market has gone both high and low. It was no accident that Buffett was buying America at 947 on the S&P. Looking back to 2001 the 940 level has significance based on pivotal moments in that bear market. There is always the chance of more downside in any market collapse but at some point value steps in and eventually the selling will stop. At 940 the S&P was undervalued and the charts showed this.
Market Direction Today
With the ECB announcement today (Sept 6 2012) the S&P 500 jumped over 1.9%. It is interesting to consider that analysts felt that the move by the ECB was “baked in” and the move would not be dramatic. They were wrong again. The hope among many investors is that the ECB announcement will solidify the Euro and stop the spread of further contagion among the weaker European states. It should also have less of an inflation impact than previously thought. Whether any of this comes about or whether the Euro issues will continue are tough to call. Certainly if investors like George Soros who earlier this year believed that the Euro had less than 3 months to live can’t get it right, than I certainly won’t.
Instead I prefer to look at the market direction trend which remains on the side of the bulls. Today’s bounce may not last and indeed I read a very good article pointing to the market pushing into a third peak sometime in 2012 before another gigantic sell off. But then that is more doom and gloom and right now there is a lot of doom and gloom. It is rare when the market direction tanks when doom and gloom is so high.
The Price To Earnings are not anywhere near as high as they were in 1999 or 2007. Earnings though have slowed and earnings are the backbone that can keep the S&P 500 at these levels. If earnings do not improve going forward than the market direction may shift as stocks come back down to match actual earnings. But that won’t be known for a few weeks yet.
Market Direction and Intel Stock Chart
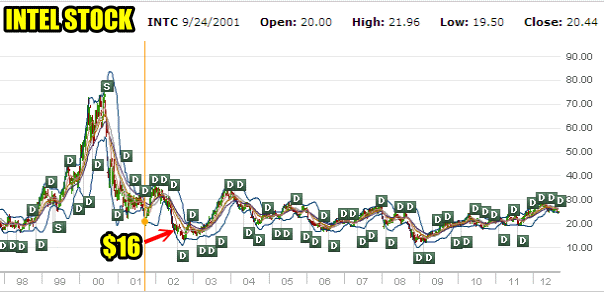
The purpose of keeping stock charts is to keep a perspective while daily events knock investors around. Below is my Intel Stock Chart for 1998 to 2012. With a chart such as this one I can see what has transpired and where opportunities may lie.
For example in 2001 I was selling naked puts against Intel Stock. Eventually in 2002 I ended up owning 5000 shares of Intel Stock at an average price of $16.00. I keep charts on stocks like Intel Stock specifically to remind myself of past events and to keep a realistic outlook on each stock. For example, I am presently holding naked puts at strikes from $26 to $23. While I have received a lot of emails from readers questioning why I would hold the variety of strikes, I can reflect back on the chart below and see that $24 to $25 are decent strikes to constantly consider and I am holding one strike above and one strike below as well as both $24 and $25.
As well I can tell that in a panic there could be good opportunity to pick up Intel Stock at very good prices. For example in 2008 I sold in the money naked puts at $16.00 when the stock was at $13.00. I sold the $16 based on the history of the stock when in 2002 I owned shares at $16. By selling deep in the money puts I was paid $4.25 for the naked puts I sold and by May 2008 they expired out of the money. The return was 30% by the time the naked puts expired.
Keeping a chart such as below gives an investor a unique perspective on stocks despite what might be happening daily.

Reviewing the Intel Stock Chart since 1998 keeps a lot of things in perspective for an investor such as myself.
Intel Stock Earnings Chart
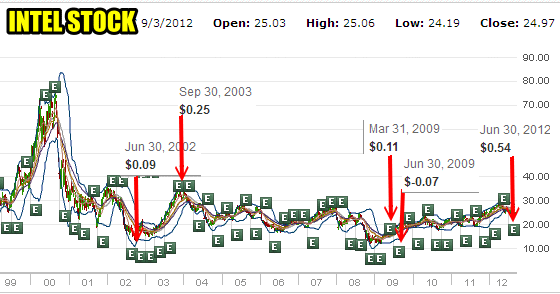
Another great aspect of keeping charts when studying market direction is watching the quarterly earnings. For example below is the Intel Stock quarterly earnings since 1999. This gives a lot of perspective. In 2002 for example when the stock was falling, a lot of people felt that it should not be falling as far as it did. But the earnings were just .09 cents in June 2002 and took a few quarters to recover until by Sept 2003 the earnings were up to .25 cents for the quarter and the stock reflected the strong recovery.
In March 2009 the earnings were just .11 cents and by June 2009 they were negative .07 cents. Obviously the bear market pushed down Intel Stock but also earnings reflected the ongoing recession. Again a great opportunity for picking up Intel Stock on the cheap while waiting for earnings to improve and the bear market to end.
Presently with Intel earning .54 cents in the last quarter, earnings are strong. Any economic slowdown though and it will be reflected in the stock price. In the paragraph above I noted how the $24 to $25 price range is decent value for Intel Stock and a good level for Put Selling.
Today with concern over a possible global slowdown, Intel Stock is presently trading between $24 to $25 again. This is the same valuations as in year’s past. You can understand now how charting has much to offer investors.

Intel Stock Quarterly Earnings Chart
Market Direction And Ignoring The Noise
By reflecting on historic charts and listening to what they have to tell, investors can ignore all the daily noise from the market and instead focus on their investment strategies. With the help of my market direction charts I can keep a proper perspective on where markets and my stocks are heading.
Myself, I know that earnings must rise to support new higher valuations in market direction. I do not need to listen to all the media, but simply wait for the earnings to come out. That will give me all the information I need. Should earning disappoint I know that I will have to adjust my Put Selling to be selling further out of the money puts, aware that earnings must improve. I realize that the market direction can continue higher for some time, but that does not mean I have to take the chance of being caught at a market top. Instead I can plot my information on charts, watch for opportunities and still enjoy profits despite whatever market direction is the flavor of the day.
