The announcement today that JP Morgan Analysts downgraded Intel Stock to market perform citing concern about Intel’s new Haswell architecture which is to be released later this year, hurt the NASDAQ and pressured the market direction. Further pressure came from Apple Stock which collapsed $13.75 or more than 3% during the day. While the NASDAQ fell 28 points the Dow came back to close down just 5.69 points while the S&P 500 representing the broader market pulled back 7 points.
Market Direction Action For Apr 1 2013
The market direction technical analysis from the weekend was looking for weakness in the market but a push towards a higher market direction towards the close. The weakness was definitely there but while the selling was contained, particularly near the end of the day, the push back to close at the 1562 level was not strong. You can see the action in the 5 minute chart below. The market direction was under pressure all day with the heavier selling in the early morning and in the last hour of the day.
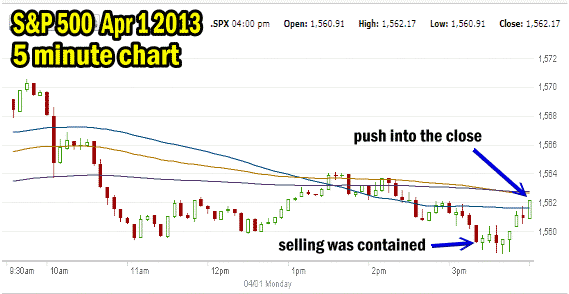
Market Direction on the S&P 500 for Apr 01 2013 in 5 minutes time frame
Market Direction Closings
The S&P 500 closed at 1562.17, down 7.02 points and the Dow closed at 14,572.85 down 5.69 points. The NASDAQ closed at 3239.17 down 28.35 points for the worst showing among the indexes..
Market Direction Technical Indicators At The Close of Apr 1 2013
Let’s take a moment now and review the market direction technical indicators at today’s close on the S&P 500 and view the next trading day’s outlook.
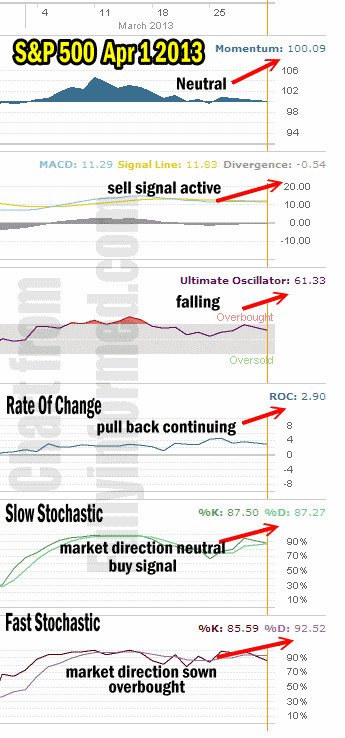
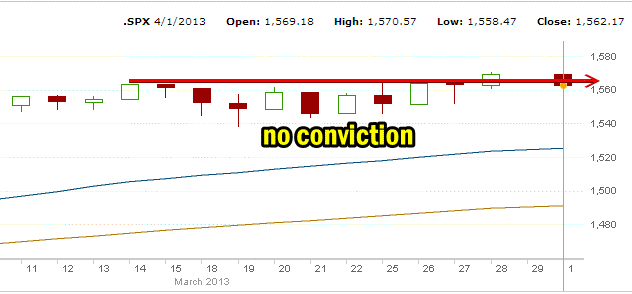
For Momentum I am using the 10 period. Momentum was neutral by the close of today but it was not negative. This in itself remains a good sign but overall market direction has been weak for the latest little rally to a new S&P 500 high. There is not a lot of conviction among investors at this point.
For MACD Histogram I am using the Fast Points set at 13, Slow Points at 26 and Smoothing at 9. MACD (Moving Averages Convergence / Divergence) is still negative and still signaling market direction is down. Overall MACD has not been impressed with the latest rally and has stayed stubbornly negative throughout.
The Ultimate Oscillator settings are Period 1 is 5, Period 2 is 10, Period 3 is 15, Factor 1 is 4, Factor 2 is 2 and Factor 3 is 1. These are not the default settings but are the settings I use with the S&P 500 chart set for 1 to 3 months.
The Ultimate Oscillator is still positive and is pulling back from oversold. It would have been better to have seen the Ultimate Oscillator push into heavily overbought. This latest pullback is signaling weakness in the market direction up.
Rate Of Change is set for a 21 period. Rate Of Change is still positive but today’s selling pressure has pushed the reading lower. This reflects the lack of conviction among investors which is exactly what Momentum is signaling.
For the Slow Stochastic I use the K period of 14 and D period of 3. The Slow Stochastic is overbought and signaling that the market direction is neutral. This means by mid-week we could see a sideways market direction develop.
For the Fast Stochastic I use the K period of 20 and D period of 5. These are not default settings but settings I set for the 1 to 3 month S&P 500 chart when it is set for daily. The Fast Stochastic is extremely overbought and is indicating that the market direction is lower.
Market Direction Outlook And Strategy for Apr 2 2013
The market direction outlook for Tuesday is for more weakness although in general Monday’s have been weak since the start of the year. As well, volume was very light, being Easter Monday for a lot of countries. The downgrade of Intel Stock and the severe pullback of Apple Stock weighed on the conviction of investors who remain jittery at best.
My outlook is for the weakness to continue. I am moving back to a cautious stance and will only scale into positions. Since mid March the S&P 500 cannot get any conviction from investors. The market direction is basically stuck in neutral as it moves sideways.
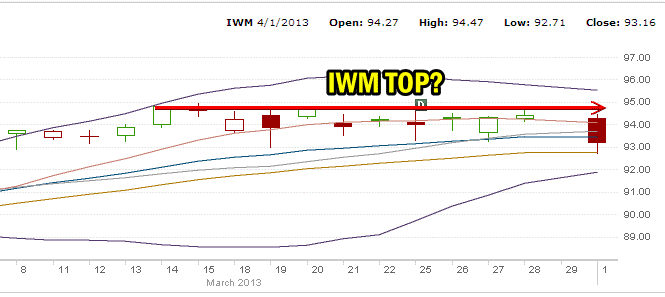
Market Direction and IWM ETF
The IWM ETF which covers 2000 small cap stocks is exhibiting more of a top than even the S&P 500. On Friday the IWM ETF issued a sell signal and today it followed through on that sell signal.
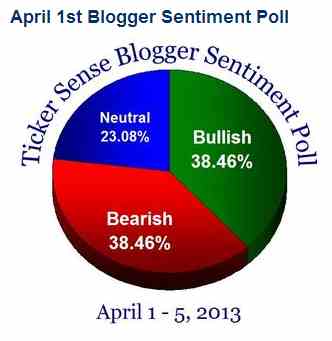
The inability of the market direction to break through the 2007 high convincingly has a lot of investors holding back. Meanwhile the financial blogger sentiment poll from the Tickersense website has the bullish sentiment now up to 38.46% of those surveyed which now matches the bearish sentiment. In the past this type of reading marked a top in a rally. Whether that is indeed the case we will know shortly.
Earnings and Market Direction
The market direction may stall here until into next week as investors await earnings. Historically the first week of April has been poor for stocks and then the rest of the month among the best for stocks. This has been the case in an overwhelming number of years since 1950. However that is never a guarantee. I believe staying cautious and putting on smaller positions is a decent strategy at this point. With the market stuck sideways we are back to the scenario that the market can only stay like this for so long before it will take the path of least resistance which is down. By staying cautious I am still earning good profits and taking advantage of the better premiums from put options.
The outlook then for Tuesday is for the weakness to remain, for investors to remain cautious and for the market direction to still try to push back higher.
Internal Market Direction Links
Profiting From Understanding Market Direction (Articles Index)
Understanding Short-Term Signals
Market Direction Candlestick Daily View (Members only)
Market Direction Portfolio Ongoing Trades (Members only)
Market Direction External Links
