Market direction on October 4 called Pieces Of The Puzzle I explained:
“For the market direction to change I believe the market must break through the 50 day, hold above the 50 day and then move higher. The last rally last just 3 sessions. This latest rally against is just 3 days. Market volume remains poor, but overall market volume doesn’t hold as much importance as the MACD does. (Moving Average Convergence Divergence).”
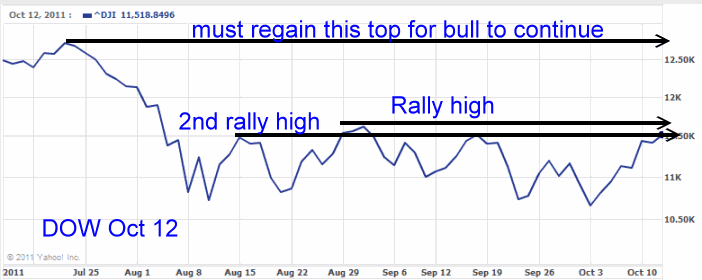
The last three sessions have been impressive despite the low volume. This link to yahoo finance gives a 6 month view of the Market Direction for the Dow (goes through an ad first). The collapse into August and the sideways action since is clearly evident.
With market direction being firmly up, today the market has recovered to the 2nd rally high which I have marked below on the Dow Jones Chart. Earlier in the day the market was up and touched the Rally High which marked the best rally in this bear market to date. In order though for the market direction to clearly change to up and the bull market return, the markets must regain and move above their July levels before the sell off commenced in early August.
All the market charts are exhibiting the same patterns since the news from Europe is more positive, pushing investors back into a buying mode.
But bear markets are tricky for analysts and investors alike. Bear markets are characterized by gap opens, hair-raising plummets and spine tingling rallies. It is easy to get caught up in the whipsaws and volatility. When markets plummet investors sell and when they are rising they rush back to buy yet again. Instead they should be doing the opposite.
Market Direction – The Collapse Of 2008
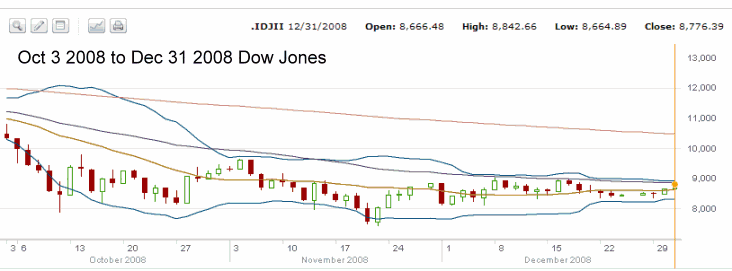
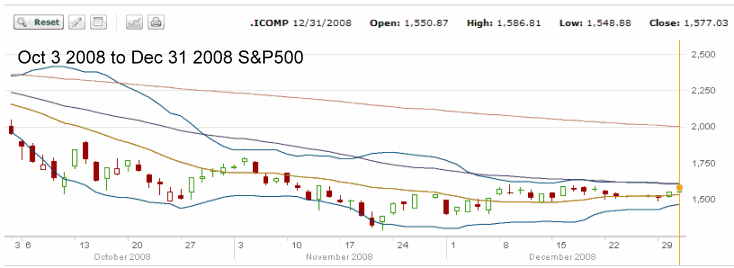
Below are a few charts from the collapse in October through to December of 2008. Once the collapse had occurred in October market direction went sideways motion with a re-test in November and a break of the October lows. This break though did not start a new further decline in Market Direction. In fact the opposite occurred as the market moved back up and held going into the Christmas 2008 period.
The same market direction action is clear in the S&P500 chart for the same period, Oct to Dec 2008.
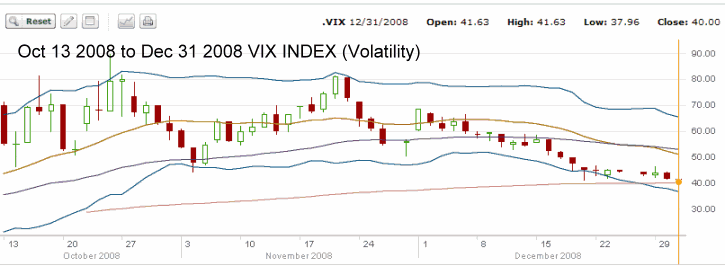
The VIX Index chart, which measures future volatility in the market, shows the opposite action to the market direction (which is correct), finally moving back to 37.94 by the end of December 2008 as the markets returned to some degree of calm.
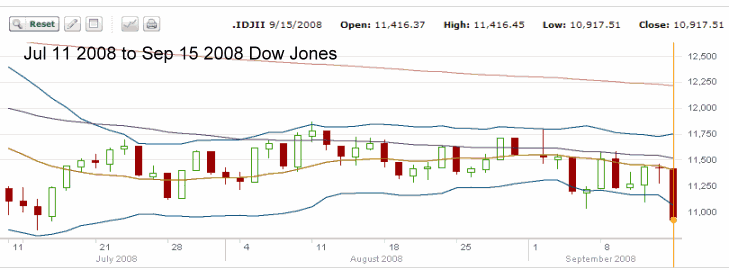
One other chart worth looking at is the period from July to September 2008. After the collapse of stocks in mid-July 2008 the market direction exhibited the same sideways actions. Rising and falling daily with what many analysts believed was a bias to the upside as they felt stocks were undervalued. The big drop on Sep 15 2008 showed investors just how over-valued many stocks still were.
Market Direction For Oct 12 2011 – Where To Now?
Since Monday I have received hundreds of emails asking me what market direction I believe the markets will take next.
Many readers are wondering if they should be back buying stocks. I think this uncertainty in the market direction makes the best case for the selling of options.
If the market is indeed recovering and the lows of August 8 are in fact the lows for this bear market, then selling puts throughout this downturn was an excellent strategy. As well, the buying of some stocks and selling in the money covered calls was also a strategy that has paid well and offered protection.
Market Direction – Best Strategies
Bear markets fool a lot of investors and analysts and I am definitely no different. Every time I felt that the market direction could break through the August lows, it has not happened except in one instance. In that instance just last week the market broke the August lows but just like the November 2008 break of the October lows, the market rallied back and has since left a lot of distance between the August lows and today’s market prices.
By staying out of the money with selling puts or buying stock and selling deep in the money covered calls, I have been able to profit from the bear market and not had to worry about whether the market is going higher or lower. If the market moves higher I can close my puts for large profits. If the market moved lower my deep in the money covered calls offer a decent amount of protection.
So it is not therefore necessary to be right in the market direction call, but it is important to be protected.
Going forward from here I would expect some market weakness after such a terrific rally as the last 3 sessions.
On Jan 20 2011 I indicated that I would be using the cautious bull strategy. This strategy which I have used in many bear markets in the past, has served me well.
I close my puts early when the profit is there, which protects my capital from possible assignment in the event of an unforeseen catalysts that could drop stocks and assigned a lot of shares to me. As well the use of deep in the money covered calls works very well in this type of market. All of these strategies work when market direction is down.
Whether or not we have seen the lows for this bear market I am unsure. Something within my instincts tells me that there are too many problems still ahead for the market to set new highs this year, but that does not mean the markets will not experience a Santa Claus rally.
If I am wrong in my market direction call, it doesn’t matter since I am staying well protected and cautious as the market moves into the winter months ahead.

