With Ben Bernanke’s comments on Friday from Jackson Hole, the market at first appeared shaky and then firmed up. Why? It could be the a lot of investors finally realize that this market is no longer on life support with a steady influx of capital. It could be that investors now realize that perhaps the market will begin to go back to trading on fundamentals like earnings. It could also be that the market when it fell, triggered short term buying by computer programs that later sold in the afternoon. At any rate the charts on the market present us with an exceptional picture that we can now finally follow.
Is It A Bull or Bear Market?
It is important for investors to understand which type of market they are in so they can prepare themselves for setting up trades properly. There is no point in selling naked puts as the market rallies only to find out that within days the market will push lower than the puts you have sold. Instead if we know that this is a bear market then we can know to sell puts in the down cycle and buy them back in the rally, so as to release the capital held for the naked puts and then put it back to use in the next push lower.
To determine what market we are in, these are the signs I look for in every market.
GAP OPENS:
Over the past 3 weeks the S&P 500 has had a gap open 16 times. This rarely, if ever occurs in a bull market. Gap opens up or down are almost always a sign of a bear market.
INTRADAY SWINGS:
Big intraday swings such as we have seen since pretty well the end of May are also rare in bull markets. They are however common in bear markets.
HIGHER VOLATILITY:
It is rare in bull markets to see big jumps in volatility. The VIX which measures the volatility is a good indicator and it has recently finally been signalling that a big jump in volatility is warning investors that this is probably a bear market.
LOWER LOWS AND LOWER HIGHS:
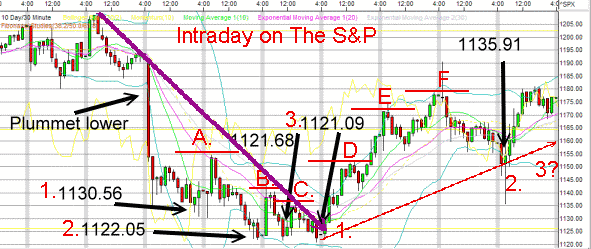
Normally in a bear market there are three lower lows and then a spectacular rally and then another 3 lower lows. This is very common in bear markets. Looking at the chart below I can see this pattern.
Using the intraday charts for the S&P at 60 minute intervals the bear process is pretty obvious.
I have marketed the three lower lows by numbes 1, 2 and 3. Next I have marked the 3 lower highs by A, B and C.
Once that played out the market turned and started back up D, E, and F.
What is troubling though is after F, the market did not make a higher low, but instead sold off lower than the rise from E and F.
If that is the case then the market should see a lower high shortly which would mark the 3rd lower high.
After that move, the market should go sideways and then possibly sell back into another 3 chart parttern. If this is a bear market then that selling should take out the lows of 1121.09. If the market does not take out those lows but hold and then challenge the highs of May, it still must overcome the highs of Feb 2011 to reassert itself as a bull market. I believe this is going to be a very tough challenge indeed.
Market Direction Summary
Based on my charts I would expect the market to move higher before selling off to a new higher low. After that it will be time to reassess to determine if the next stage of the market will be to move lower and once again set up 3 more lower lows before repeating this cycle.Remember in my market direction call of August 17 I indicated that this market must regain the 1260 level on the S&P and hold that level decisively. Once that is accomplished then the market must move higher and challenge the February highs in order to confirm that this was not a bear market but a correction in an ongoing bull market.
My believe is that this is a bear market. As such I will continue to use bear market strategies in order to earn income while protecting my longer term positions.

