Market Direction continues to confound analysts and proves why put selling is a very practical method of investing. With so many stocks setting new highs and analysts worried about the overbought market conditions, Put Selling against large cap stocks continues to bring in profits while affording a low-level of protection against possible whipsaws in the market. With the VIX Index at $13.50 there are not a lot of whipsaws to be found particularly on large cap stocks which makes Put Selling attractive going forward.
This could change of course and market timing indicators still show the market is sitting at extremes. Friday was a good day but the market direction is primarily grinding its way higher in small amounts. This isn’t a runaway stock market rushing higher and that’s often a good thing for bull markets.
Candlestick Chart Analysis
For the first time since July 31 when candlestick chart analysis gave a sell signal, a buy signal was generated on Friday at the close from candlestick chart analysis when the market opened higher than Thursday’s close and closed near the highs for the day. This formed which is called a white spinning top. Since candlestick chart analysis missed completely the latest rise, perhaps investors should be concerned now?
Market Direction Breakout
The S&P 500 closed at 1418.16 on Friday almost at the April 2 high when the market closed at 1419.04. The intraday high that day was 1422.38 and on Friday the S&P 500 was within spitting distance. The Trader’s Almanac which had moved its investors out of the market in mid-April may be wondering what in the world happened. It would appear that the world’s economies have not yet fallen off a cliff. With US housing permits rising and unemployment continuing to decline, albeit slowly, the economy is still hanging on, creating some jobs and continues to crawl forward.
Market Direction Fakeout
So is this a market direction breakout or actually a fakeout? It’s still tough to know. When I was investing in the 1970’s every analysts I read was bearish on the markets and on the economy. It was like 10 lost years. But the market actually continued to slowly recover from the collapse that took place half way through and within about 5 years it had doubled in value, recovered all its loses and confounded economists and analysts alike. Sound familiar?
Earnings Though Are Down
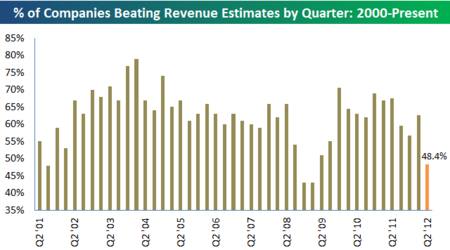
With most of the earnings now have been reported from the second quarter, as a group they are a disappointment as earnings over the past quarter were among the lowest since 2008 and 2009. But with stocks climbing a wall or worry perhaps they are advising that better times lay ahead and earnings may pick up. The rise of the US dollar certainly didn’t help a lot of companies this past quarter.

Earnings in the second quarter are lower than all previous quarter except for 2008 and 2009. Chart from Bespoke.
Put Selling Market Direction
This is exactly why I do not follow the market gurus. Instead I like to stay with my short-term market timing technical indicators and continue to do Put Selling on large cap stocks. Unless there was going to be a market collapse, then there is every reason to stay in a correction to profit from large put options premiums.
Market Direction and The September Effect
One last thing before I present the market timing indicators from Friday is to remember the September effect for stocks. September has been a notoriously poor month for stocks for almost 18 years. In 60% of those 18 years the S&P has fallen almost 6%.
Market Timing Indicators For Friday August 17 2012
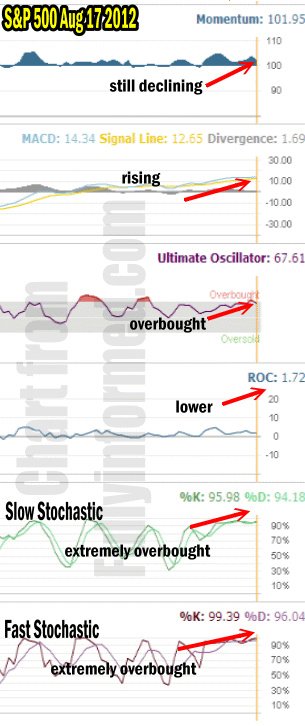
Not a lot to report from the market timing indicators from Friday. The market timing indicators are either extremely overbought still or are trending sideways.
Momentum is declining but still positive and one of the indicators pointing to a sideways bias rather than down.
MACD is still climbing but barely so it too points to a sideways market.
The Ultimate Oscillator is still showing a very overbought market.
The Rate Of Change indicator is lower but again barely and it too points to a sideways market.
The Slow Stochastic is extremely overbought but there is still some room to the upside.
The Fast Stochastic is also extremely overbought and with a reading of 99.39 there isn’t much more room to the upside. This could mean some selling for Monday or Tuesday but with the slow stochastic showing a small amount of room to the upside still left, the market may still end up higher as the week progresses.

Market timing indicators are still extremely overbought and the rest are sideways
Market Direction Outlook to Start The Week of August 20
The market direction outlook is for the market to pullback and this has been the case for at least 3 prior trading sessions. With half the stochastic overbought and the other half trending sideways the market direction may still be able to climb a bit higher, but it will have to pull back eventually to regroup. With the VIX at $13.50 it is rare when a reading that low will continue for more than a couple of weeks. I would expect market direction to fall early in this week and then try to close higher going into Friday. According to the Trader’s Almanac, the end of August tends to see stronger market moves which September is poorer. This could easily be the case this week for market direction, and with stocks so overbought it should be just a matter of a few days before a pullback happens or at least that’s the normal pattern. So whether the market direction is on the verge of a breakout or this is just a big fakeout is hard to tell, but then because I sell options as my principal investment method I never worry. There is always a profit somewhere no matter what the market direction is.
