I have been watching the market direction the last few days to try to gauge where I think it could be heading. First, it is important to realize that this week is a fairly quiet week as far as economic indicators are concerned. As well it is also August options expiry week so I would expect the market to try to move higher or at least not sell off.
However after this week what will be the market direction?
The last few days the media has been filled with the doom and gloom or the dreaded death cross. While it is commonly a sign of a new bear market, I have seen more death crosses that have turned out to be wrong, than I can remember. The same with the golden cross which is always suppose to show a bull market trend.
I don’t want to minimize the death cross signal but I do prefer to look deeper than the death cross.
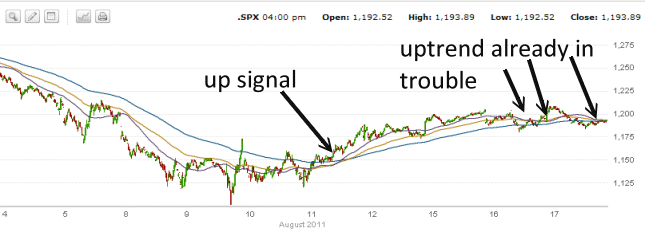
The first thing I looked at was the last few days in the S&P 500. The chart below shows the last 10 days of the S&P 500. After the incredible volatility of last week, the market gave a short term uptrend signal. The market direction though lasted only for a few days before the moving averages already are showing the uptrend is trouble.
Market Direction – Goal Is 1260
As this week there is very little economic news and an options expiry week, I would have thought the market would move higher. It has not. Instead the market is stuck sideways.
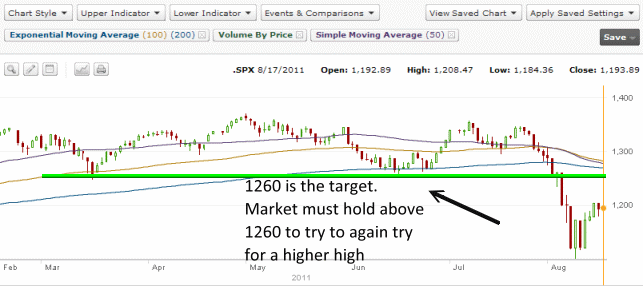
The S&P 500 chart below is key to understanding market direction. If the market is still in a bull cycle, it must quickly regain the 1260 level, which marks the lows of the past 6 months.
Once the 1260 is regained, it must hold at that level before mounting another attempt to set a higher high in the market. It does not matter if the S&P 500 regains the 1260 and takes into the fall to mount a new move higher, but it must regain and HOLD the 1260 in order to confirm that the bull market still has some life left.
What is the possibility that this will occur in the next few weeks or at least by early September? My vote is less then 50/50.
The rally since the panic selling of last week, could easily be a bounce. The market was definitely over sold.
However MACD, or Moving Average Convergence / Divergence, is showing that while the market is under pressure, it is slowly stabilizing.
Here are the past readings:
August 8 2011 – divergence = -19.64
August 9 2011 – divergence = -18.50
August 10 2011 – divergence = -19.97
August 11 2011 – divergence = -16.33
August 12 2011 – divergence = -12.56
August 15 2011 – divergence = -7.63
August 16 2011 – divergence = -4.61
August 16 2011 – divergence = -2.10
The rise in MACD is a good sign for those on the bullish side of the S&P. However a change in market direction to up should be expected after such MACD settings as August 8 to August 11 2011. However note how the divergence remains negative despite some good up days. In order for the market direction to make a permanent change to the upside, there needs to be more buying and stronger market technicals.
Market Direction Summary – August 17 2011
The market needs to reach 1260 and hold that level in order for the market directon to change back to up. Personally, I believe the bear market has returned and should the market reach 1260 I will not be surprised to see selling resume.
The problems facing the economy are enormous and without the financials recovering and rallying higher, without housing rebounding and without better employment numbers the market direction could be sideways for months if not years.
Overall when selling put options on stocks you don’t want to own, I would consider examining the charts from 2008 to 2009 and pick strike levels that are far enough out of the money to afford a chance to roll any sold positions lower in the event that selling resumes.
Meanwhile having extra cash aside to take advantage of a market direction decline into September and October is for me, not too bad an idea.


