This week’s trading sessions have been anything but normal for any of the markets and deciding on market direction is very difficult. Analysts are split on what is happening and what to expect.
If you do a google search you will find hundreds of blogs who claim there is more selling ahead and those who feel the selling is overdone and the market has set a bottom. There are all kinds of technical jargon being bantered about including diamond formations, ticker strength, overheated MACD, histograms that are too high to be supported, bull flags, bear flags and more. All are trying to figure out the market direction.
The yo yo pattern is truly unique and shows not only investors indecision, but also the fear of investors. They fear they may get caught in the downturn while at the same time fear they may get caught missing a rally.
MARKET DIRECTION – BEST GUESS
This is not a market for the faint of heart. The volatility is whipsawing positions and many have lost large sums and others made terrific profits.
Yesterday I was not in the market drop and today I was not in the rise. Instead I decided to look beyond the noise and confusion and study the technicals as I try to determine the market direction.
I felt after the market broke the March lows that a new bear had emerged. While a bear market is normally by definition a decline of 20%, this market is exhibiting different signs.
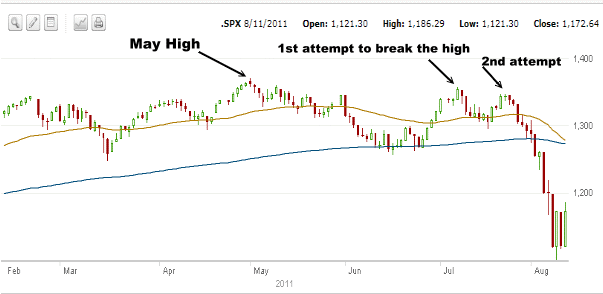
To try to understand market direction I first looked back 6 months. In the chart below the May high is obvious. The S&P 500 then attempted to break this high twice. The first time came close and the second failed to reach the high of the 1st attempt.
This is a classic sign of a market in trouble. The bull market should have been able to continue the market direction. When it could not and failed the second time, the market pulled back and commenced to fall.
At the same time it is important to recall that the market direction changed in February with the Japanese earthquake and tsunami. This was a natural disaster which turned into an economic one. Such a disaster can and usually does have global implications that can last a year or even longer. So does this mean that this weakness could eventually turn and the economy pick up late this fall or into Spring of 2012?
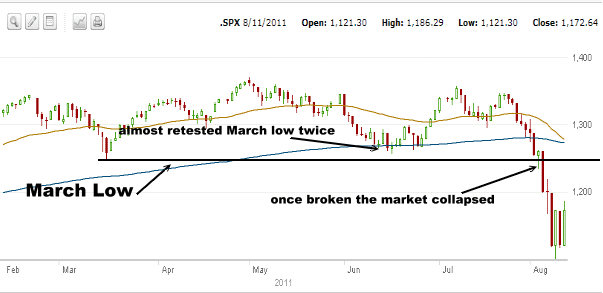
As to the lows of the bull market, in the chart below, the March low set in place the move for the market to move into the May high. After that the market direction changed as the market fell after setting the May high but failed to reach the March low, twice. After that the market direction changed as the market attempted to rise to new heights.
Once the March low was broken the market literally collapsed. The collapse beyond the March low normally would mark the end of the bull and beginning of a new bear market. Even if this was a bull market in a secular bear, it doesn’t matter. The collapse of the market through March lows and with such conviction and volume truly looks like the end of the recent bull run.
Market Direction For The Past 5 Days
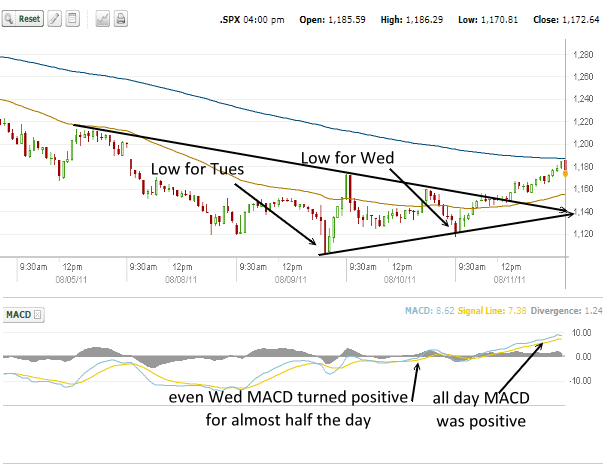
The chart below is for August 5 to August 11. The low for Tuesday was actually not met on Wednesday and so far that low has not been revisited. Looking at the downtrend and the recent upmove seems to point to a possible test of around 1140 on the S&P 500. If the market does pull back that low and then rally, this could mark a bottom short term or intermediate.
As well in the chart below, I can see that on Wednesday when the market pulled back so dramatically, MACD was actually positive for half of the day. Today MACD was positive for almost the entire day and even with the quick drop at the end of the day MACD stayed positive.
I am wondering if by chance this downturn is not a change in the bull, but an actual severe correction. Bull markets can change market direction, shake out investors in severe downturns only to turn right around and continue the bull market. I have been wrong before with market direction calls and this won’t be the last time.
One aspect of the market that bothers me is looking at leader stocks.
Many of these stock did NOT break rank. For example Priceline stock has been a leader all year. It failed to have the 50 day, 100 day or 200 day change direction despite the downturn in market direction. Actually the 50 day remained pretty solid despite all the selling of the last week.
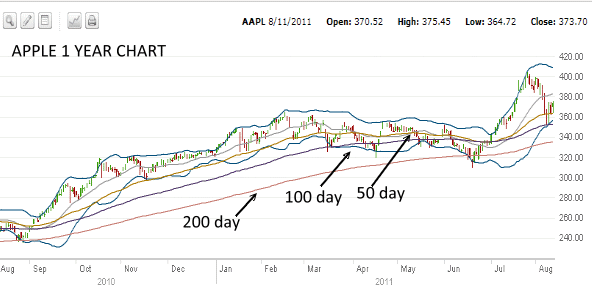
Below is APPLE INC Stock. Again in the recent selling the 50 day moving average has not fallen and in fact has continued to climb. The moving averages on Apple continue to support the bull market cause. This stock has been a market leader for much of the bull market.
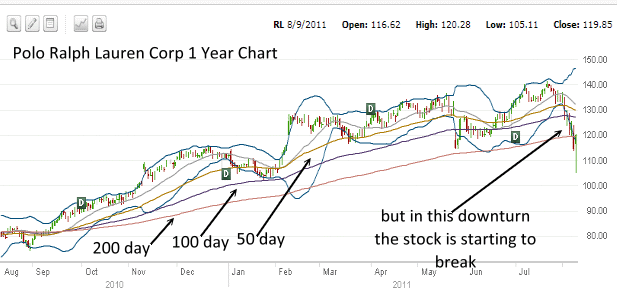
Meanwhile supporting the case for a bear market are big stocks like Polo Ralph Lauren Corp below, which have lead the market for a year, but in this downturn the stock is breaking down.
Market Direction – What The Experts Think
The problem with the whole bear market call is that so many analysts including myself are calling for it. Bear markets tend to creep up on investors and then suddenly are full blown. But in this market the number of experts who think this is a bear market now, is over whelming.
Barrons Michael Khan see 1010 to 1050 as the next support zone and then once that breaks then 930. One comment that mirrors my own is he sees this market as being very similar to the 1970’s which is something I have pointed out in numerous article.
Sandy Jadeja of City Index, believes the market could rally for a few sessions and then move to 9670.
David Sneddon, of Credit Suisse in London, believes support is around 1020 and below that he would call this a genuine bear.
Standard and Poor’s Mark Arbeter, thinks there could be a short term rally and then a fall below 1023 and possibly as low of 935.
The most dire prediction is from Prem Watsa CEO of Fairfax Financial who is calling for deflation for much of the world and in particular in the United States. He likens the future to the 1930’s and predicts the markets will decline dramatically from this level. He has long term bets against the S&P rising and holds much of Fairfax assets in treasuries and US Government debt which he believes will perform incredibly well, despite the belief by others such as Bill Gross of Pimco that treasuries and US Government debt should not be held by investors. He has 100 percent of Fairfax Financial stock holdings hedged. While it may seem implausible to believe Mr Watsa, he bet against sub-prime when others saw no problems and benefited enormously in 2008 due to the credit crisis.
Market Direction – Summary for August 11 2011
There are so many signs supporting the bear case and the bull case that investors are stumped as to the correct market direction. It is this indecision that is leading to the yo yo effect on the market. At the same time it is unusual for the market to fall and reverse 400 and 500 point days in a bull market. The continuing yo yo effect supports the bear cause for overall market direction. These types of moves do a lot of technical damage to the overall market.
Therefore even if the market direction is actually up, it is questionable for how long and for how high. This is what will probably keep volatility high and could lead to continuing high premiums for options which should certainly benefit my style of investing.
Personally I believe more in the bear cause than in the bull. However I still recall the crash of 1987 which was devastating and in the end was not the beginning of a new bear market and did not herald a new recession. Could these past few days just be investor panic and concern? After all it’s not every day that the US credit rating is downgraded and the public spectacle of the US debt ceiling was downright shameful. Meanwhile with all the European Debt problems and their inability to actually contain the growing dedt issues, this support the bear market direction.
So the question for bulls has to be, if in fact this is not a bear market, what is the likelihood that the bull can move back higher and surpass the May highs? My believe is that the economy will drag along with limited growth, high unemployment, debt issues and depressed housing prices for what could be a long period of time. Personally I have been calling for a deflationary environment for more than two years and I still believe deflation and not inflation will win out.
With all these issues, I believe the bear market has returned and in this kind of environment the market direction could actually be sideways for years. I see nothing wrong with raising cash and staying on the sidelines while the market direction remains unconfirmed.

