Market direction and the 200 day moving average is a very important indicator. I know that a lot of investors think market timing through technical indicators is all nonsense or as close to stock market voodoo as you can get. But there are too many indications that market timing technical indicators work that I am always astounded by how many investors brush aside any evidence that proves the value of the 200 day moving average and watching market timing signals to determine market direction.
Last night for example I explained in my market timing column how while the slow stochastic on all the markets showed continued weakness, the fast stochastic showed big rally ahead. The IWM index was among the best to look at as the IWM fast stochastic was so bullish that I would have been shocked to have seen just a little move up in market direction today.
Market Direction and 200 Day Moving Average
The 200 day moving average is paramount to any stock market and even the professional traders and institutional investors watch the 200 day moving average.
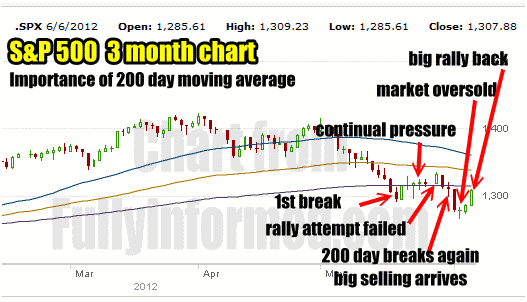
The below chart shows the importance of the 200 day moving average. On Friday heavy selling erupted as the 200 day had been breached for a second time. This is often an indication that the stock market will move lower and it brings out big selling as I mentioned in previous market timing / market direction articles. When the 200 day moving average breaks investors become nervous and rightly so.
The 200 day moving average marks a mid-term trend indication. As long as stocks are moving higher the 200 day moving average lends support to the markets. Market direction can move up and down but as long as it does not break the 200 day moving average then the overall long-term direction is intact.
The chart below shows a typical 200 day moving average correction. The 1st break of the 200 day moving average concerns investors. The stock market rallies back slightly but continually pressures the 200 day. Then a rally attempt fails and the 200 day moving average breaks. With the second break sellers arrive and dump shares. Selling then slows as most sellers who wanted out are out. The market though is oversold. A few pushes lower such as we saw on Monday and Tuesday are bounced right back. This tells investors that there are buyers waiting lower. Instead buyers step in now and buy stocks. This results in the big rally we are seeing today as those buyers sitting lower jump in now worried they may miss the next move up.

The above Market Timing chart shows a typical 200 Day Moving Average correction
Market Direction and 200 Day Moving Average 2010 Correction
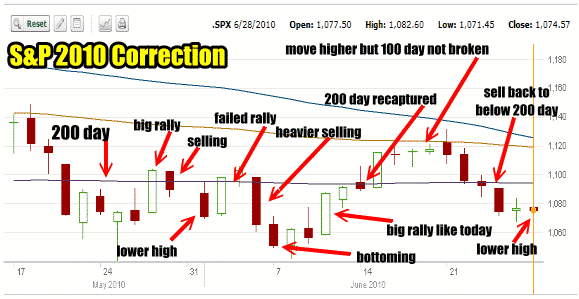
The year 2010 saw a similar market correction and once again at the 200 day moving average. I have plotted out the same scenario below. You can see where I have marked the “big rally like today”. Note how the big one day rally pushed to the 200 day moving average just like today. Tomorrow then we should see a bit of a follow through if the market holds the 200 day moving average.
Then a slight test which I have marked “200 day recaptured” and then a move up. In 2010 the market rally failed to break through the 100 day moving average which plunged the market back below the 200 day moving average. However the market direction plunge ended with a lower high than both the two previous market lows. This was the signal that the next rally would push the market back up and continue the bull market.

My market timing chart from the 2010 market correction shows the importance of the 200 day moving average
Market Direction and 200 Day Moving Average 2011 Correction
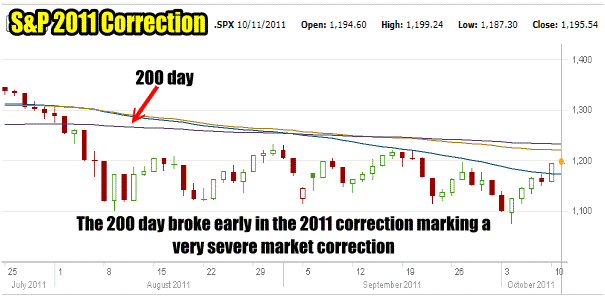
The 2011 market correction was far more severe and resulted in the 200 day being decisively broken right at the start of the market direction plunge in July 2011. This spooked many investors who were unable to get out early enough. They therefore started selling within 3 days of the break of the 200 day moving average.
The S&P tried repeatedly to push market direction back up to recover the 200 day but not until October did the 200 day moving average see stocks cross back up. There was one more market direction plunge in November 2011 which broke the 200 day again, but the bottom of that plunge made a new higher low and the market then rallied into 2012.

My Market Direction and Market Timing chart of the 2011 correction shows how rapidly the 200 day moving average broke
It is understandable that so many investors, large and small, leave markets when the 200 day moving average breaks.
Comparing Market Direction And The Last 3 Corrections
If we compare the market direction for the past 3 years and look at the market corrections you can see that the 2010 correction is quite similar to this correction. Lots of activity at the 200 day moving average. The 2011 correction was far more severe and did not follow the same pattern as the correction this year.
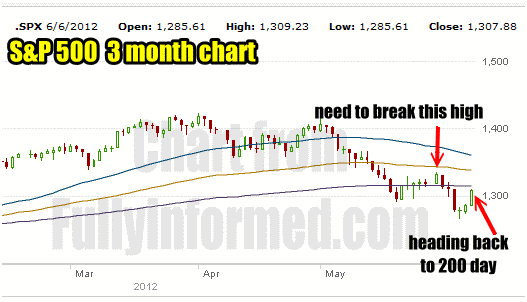
Therefore right now I am following the 2010 correction pattern as it applies to 2012 and I see many similarities. I would therefore expect some follow through on today’s action and then a test of support. I do think the 200 day will be tested again and the market may even want to retest support as low as the 1266 level which was reached on Monday. For the present correction to end the market has to recover the 100 day before a lot of buyers will step back in and push the market direction higher which should end this correction.

Market Direction On June 6 2012 as the market pushes toward the 200 day moving average
Europe And Market Correction
It is important to remember as well that investors in general are primarily interested in the US Stock Markets. Despite emerging markets and all other world markets, most investors focus on the US. Despite what any analysts would have investors believe the United States is the richest, most influential country on the planet by far. The entire economy of Greece is about the size of the state of Maryland. The entire economy of Spain is less than the state of New York. In fact the entire country of Canada has a GDP less than the state of California. Therefore I as an investor are far more concerned about US consumption, GDP growth, interest rates, unemployment, housing and economic outlook than any other nation. China, the number two economy of the world is barely 25% of the US economy.
Therefore the rumblings from overseas confuse and frustrate investors as basically most just want it to go away. They really do not understand the preoccupation with Europe and could care less about Europe’s continual problems. Indeed it is understandable as Europe has always been unable to get along, has never worked out any long-range problems, is constantly at odds with one another and rarely can agree on anything that benefits all citizens as the focus is primarily on their local needs and wants. It is sad that even today the Euro Union still looks to the US at times to lend support, financial aid and direction.
As the market direction continued lower in this recent correction investors have become increasingly disconnected with the never-ending crises of Europe. By the time we reached 10% down and broken cleanly through the 200 day, most investors no longer cared about Europe. They felt that Europe is never going to get their act together and many stocks did fall low enough to spark interest among investors. Therefore we could see a rally that might last a few days to weeks until either more bad economic news or poor news out of Europe spooks investors again.
What Market Timing Says About Market Direction
The market was deeply oversold just three sessions ago. A snap back rally is to be expected. The question will be whether the rally has any legs and can keep pushing market direction higher. For that answer on market direction, my market timing indicators will want a day or two to decide. Right now today’s big bounce is what was expected and predicted by the fast stochastic which is among the best market timing indicators for short duration market direction changes. We will have to see what it says over the next couple of days.
