Market direction is perhaps the most important aspect of investing. While I can use my market timing tools to study the market direction trend and apply these same technical tools to predict individual stock movements, almost all stocks are affected by market direction.
Should market direction change in a major way, almost all stocks are affected. It is rare when even the strongest stock refuses to follow market direction when market weakness becomes broad and grows daily. If my market timing technical indicators are correct, there could be some opportunities shortly for put selling as well as stock buying at much better valuations.
In my market timing / market direction article for the week I indicated that as long as the dip buyers continued with their dip buying then the underlying market direction trend would remain higher.
That market timing column can be read here. Monday March 27 was a very good day as Mr. Ben Bernanke warmed the hearts of investors with his talk of continuing low-interest rates. But a lot of investors did not seem to hear that there is very little talk about any further “quantitative easing” and indeed the amount of money being pushed through the system by the Federal Reserve has declined throughout the past 6 months.
Market Timing / Market Direction And Rallying On Bad News
The market has had a very nice three months that saw it rally on good and bad news. This is a sign of a bull market. Bad news is swept under the rug so to speak and market direction continues higher. My past market timing columns have mentioned this several times. I have also mentioned that when bad news turns the market that is a sign of weakness and may mean a change in market direction.
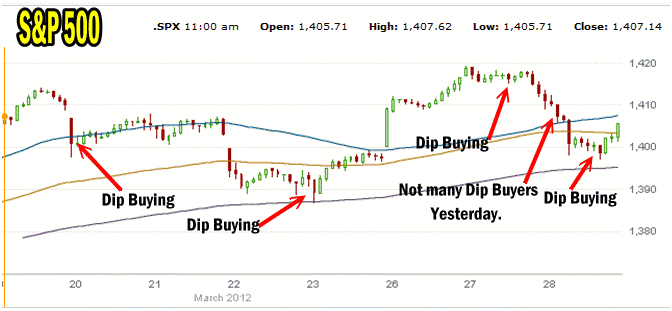
The biggest supporters of this 3 month rally have been the dip buyers. This professional traders watch for weakness in the market direction and individual stocks and buy those dips eventually pushing the market direction higher. Dip buyers were there again today as the S&P fell below 1400 for a short while before rallying back into the close. However yesterday the dip buyers were absent, which marks the first such day in 3 months. You can see this on the S&P 500 chart below from the past few trading sessions.

Market Direction Might Appear Intact Buy Tuesday Saw Limited Dip Buying
As well the S&P 500 chart for March has been weaker than February and indeed the market timing technical tools I use are also beginning to show signs that the market may need a rest. If that is indeed the case than Market Direction will obviously change.
Trader’s Almanac Statistics For April
According to the Trader’s Almanac April is the best month for Dow with an on average gain of 2 % since 1950 and second best for the S&P. It is the 4th best month for the NASDAQ since 1971. However the Trader’s Almanac also points out that during election years April has often been a weak month.
Market Timing Analysts Predict Clear Sailing
Many analysts are pointing to the S&P 500 breaking through the 1350 barrier as a strong technical indicator that the S&P has clear sailing ahead. As well technical analysts also look at the NASDAQ with its incredible rise as another sign that the storm clouds are gone. But the NASDAQ of today is different from that of the tech bubble days. Today’s NASDAQ is dominated by Apple Stock and to a lesser extent by Google Stock. The NASDAQ today is not as broad an indicator as it was more than 10 years ago.
Market Timing / Market Direction Technical Indicators

Market Timing / Market Direction Technical Indicators for March 28 2012
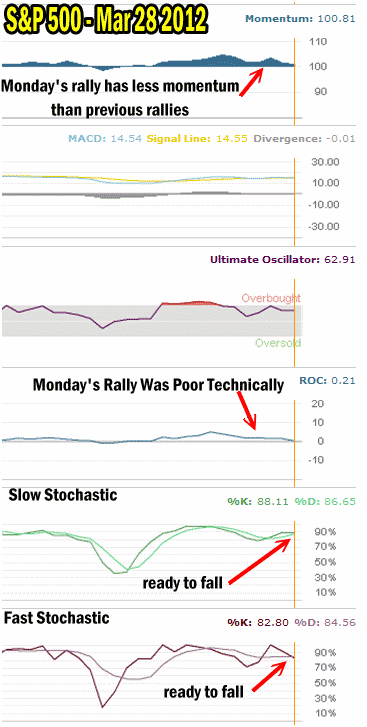
My market timing indicators are signaling a change in market direction may lie ahead. Momentum in Monday’s rally despite it being a huge rally was not nearly as strong as the previous rally.
MACD which has given some very strong readings of the last few rallies, gave only a 0.52 reading of Monday’s rally.
Monday’s rally also did not put much of an upswing into the Ultimate Oscillator, my favorite market timing technical tool and one that I have a lot of faith in.
Rate Of Change is even more telling . Friday’s market saw a reading of 1.90, while Monday’s big rally only saw a reading of 1.47. Tuesday was 1.31 but today is a dismal 0.21.
For both the slow and fast stochastic Monday’s big rally needed follow through which did not occur. The Fast stochastic is the more telling right now as it has spiked on Monday and turned back down. Unless the market turns up from here the Fast Stochastic will fall lower and give a signal that the market may be ready to pull back from here.
Market Timing Warns Market Direction Could Be Changing
The most important telling aspect of my key market timing technical indicators is their poor reading of Monday’s rally. Without a follow through they are warning of a possible market direction change.
I am not looking for anything serious but March has not been a stellar month and with so many investors and indeed analysts bullish it seems to me that they are on the opposite side of the market timing technical tools which are advising that unless the market can turn back up and move beyond the most recent new highs, market direction could be on the verge of change.
Market Timing And My Investment Strategy Now
For those who sell covered calls but do not want to be exercised from their shares, this could be a period when covered calls may provide some income if the market direction does turn down. For put sellers I am holding off selling puts for income as I believe better opportunities may be ahead. I think the recent rise in the VIX, while not a market timing technical indicator, could still be advising that more volatility is coming which will make put selling on my favorite stocks more profitable as option premiums rise.
