Market direction is always the single most important ingredient in investing. Without having some idea about market direction it is next to impossible to profit consistently from investing in stocks. Simply buying stocks whether for their dividends or not, without any idea about market direction is a serious mistake that many investors make.
On Friday with the S&P 500 off by 2.46%, marking one of the worst days for the S&P 500 in 2012, the outlook still looks very bearish for stocks. Part of the problem aside from the Euro Crisis is that the 200 day was broken through so decisively.
Market Direction And The 200 Day Moving Average
Once the 200 day moving average breaks, it is rare for market direction to reverse course. Market direction can bounce, but the downward trend is set once the 200 day moving average breaks and that is because the 200 day has such strong support that when it breaks investors bail.
It’s hard to fault investors for leaving the market with the 200 day moving average breaks. Buy leaving when they do they pull their cash out of the market and can wait out the market correction and buy stocks at cheaper prices. But this selling by so many investors pushes the valuations lower and the 200 day moving average which was once support quickly becomes resistance as every time the market tries to rally back to the 200 day, investors sell more stocks.
This is because overall the breaking of the 200 day moving average is in almost every circumstance followed by further selling and lower valuations.
The S&P 500 chart below from the 2011 market correction shows just how vulnerable the market becomes when long-term support such as the 200 day moving average breaks. You don’t want to look at the 2008 break of the 200 day moving average.

The market correction of 2011 shows the typical 200 day moving average break.
Market Direction and Market Timing Tools for Friday June 1
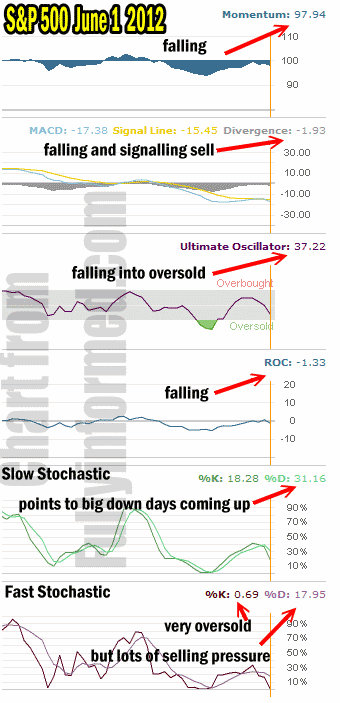
My market timing tools for Friday are, well terrible. The fact that Friday broke the lows of May is not a good sign at all and technically it is a market breaker. Momentum is falling and just getting started.
MACD (Moving Average Convergence / Divergence) is falling and has issued another sell signal.
Ultimate Oscillator is falling rapidly and moving quickly toward oversold.
Rate Of Change is negative reflecting Friday’s selling but advising there is more to come.
The Slow Stochastic with a reading of 31.16 for %D is predicting heavier selling ahead. Since the slow stochastic looks out beyond one or two days this market timing tool has particular impact on advising us where the market is heading in the near future.
Finally the fast stochastic with a %K reading of 0.69 is very oversold, but the %K reading is a hefty 17.95 signalling short-term more selling to come.

Market Timing Indicators For June 1 2012 show lots of weakness in the stock market
Market Direction And The 200 Day Moving Average Signal
The market direction outlook is down and then down some more. Any bounce is basically an invite to unload shares and prepare for more downside. Whether this turns into a full-fledged bear market is too early to predict but Friday’s market action was incredibly bearish with the market not able to rally at all for the entire day.
The fact that the market did not attempt to struggle back toward the 200 day moving average is also bearish. Just as the 50 day broke, the constant pressure and retesting of the 200 day moving average signalled that the market was going to fall further.
The outlook is for more selling ahead and watch for bounces in market direction to be sure not to get trapped into thinking that stocks are going to recover any time soon. Bounces up in market direction are opportunities for trading options and to sell stocks bought during market weakness and nothing more.
