Johnson and Johnson Stock is widely held by small investors and institutional investors. In 1972 Johnson and Johnson stock dividend was just .009315. Today Johnson and Johnson stock pays an annual dividend of $2.25. Book value is $20.95 per share and cash flow is $4.78 per share. Johnson and Johnson is well-managed but it is not seeing substantial growth. Meanwhile with a Price to Earnings of 17.3 times it trades at a slight discount to other stocks in the diversified pharmaceuticals industry. Profit margin is 15.55% which is above the industry average of 11.7%.
Johnson and Johnson stock debt to capital ratio is low at 24% and its dividend payout ratio of 61.7 X is in line with the industry. Johnson and Johnson’s market cap is 173.3 billion and has revenue of 65 billion making it the 8th largest pharmaceutical company in the world.It is also the fifth largest global biologic company, the sixth largest global consumer health company and the world’s largest diverse medical devices and diagnostics company. Johnson and Johnson stock trades on the New York Stock Exchange. Johnson and Johnson operates in 60 countries and has its head office in New Brunswick, New Jersey. Stock symbol is JNJ Stock. To learn more about investor relations select this Johnson and Johnson stock link.
Johnson and Johnson Stock Strategy For 2012
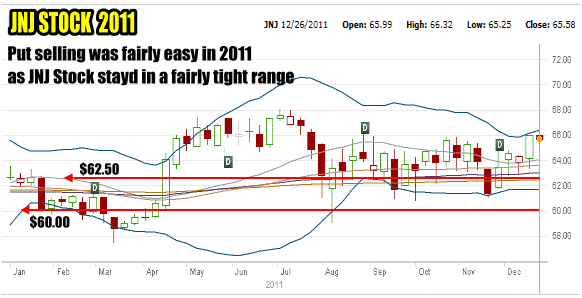
The investment strategy for Johnson and Johnson stock takes into account the trading range the stock was in for much of 2011.

Johnson and Johnson stock 2011 history chart
For 2011 Johnson and Johnson stock was easy to trade in the $60 to $62.50 range for both put selling and for buying and selling stock. My strategy for 2012 will remain primarily put selling and when appropriate buying the stock on severe pullbacks to take advantage of the trading range and selling the stock as it moves back up to the top end of its trading range.
| Review Johnson and Johnson Stock Trades For 2011 Review Johnson and Johnson Stock Trades For 2010 Review Johnson and Johnson Stock Trades For 2009 Johnson and Johnson Stock Trades For 2012Current JNJ Stock Status – Year 4Capital Currently In Use: $68,378.25 |
| Date | Stock At Time Of Trade | Action Taken (All Figures Are US Dollars) ACTIVE TRADES ARE HIGHLIGHTED | Comm. | Shares Held | Capital In Use | Gain/Loss | Total Income |
| Dec 17 2010 | 62.54 | Final Trade From 2011 / Sold 10 Johnson and Johnson stock puts for Jan 2012 $60 for $4.60 (status: expired) | 9.50 | 910.50 | |||
| Nov 25 2011 | 61.20 | Final Trade From 2011 / Sold 4 Naked Puts 21JAN12 $57.50 for .90 (status: expired) | 12.00 | 23012.00 | 348.00 | ||
| Nov 25 2011 | 61.20 | Final Trade From 2011 / Sold 3 Naked Puts 19JAN13 $57.50 for 5.25 (status: closed for .04 cents) | 10.75 | 17260.75 | 1564.25 | ||
| Dec 19 2011 | 63.40 | Final Trade From 2011 / Sold 5 Naked Puts 18FEB12 $60.00 for .65 (status: expired) | 13.25 | 30013.25 | 311.75 | 17130.25 | |
| The above 4 trades are still open at the end of 2011. You can review 2011 JNJ Stock Trades here. | |||||||
| END OF 2011 TRADES | |||||||
| Jan 13 2012 | 65.26 | Sold 5 Naked Puts Johnson and Johnson Stock 18FEB12 $62.50 for .62 | 13.25 | 31263.25 | 296.75 | 17427.00 | |
| Jan 20 2012 | 65.27 | January options expiry: Jan $60 naked puts expired; Jan $57.50 naked puts expired | |||||
| Feb 17 2012 | 64.99 | Feb Options expiry: Feb $60 naked puts expired | |||||
| Mar 22 2012 | 64.50 | Bought 500 shares of Johnson and Johnson stock at $64.50 for a quick bounce. Comments: All market timing indicators point to the stock bouncing back higher from this period of weakness. | 7.00 | (32264.00) | |||
| Apr 2 2012 | 66.00 | Sold 500 shares of Johnson and Johnson stock at $66.00. Comments: While the market timing technicals still point to the stock moving higher, volume is dropping off and my goal was $66.00. I therefore sold today. | 7.00 | 32993.00 | 729.00 | 18156.00 | |
| Apr 16 2012 | 63.75 | Bought 1000 shares of Johnson and Johnson stock at $63.75 Comments: To read about this trade and my reasons for buying stock select this link. | 7.00 | (63757.00) | |||
| Apr 16 2012 | 63.75 | Sold 10 Naked Puts Johnson and Johnson stock 20APR12 $62.50 for .29 (status: expired) Comments: This is a quick trade of a week for 0.46% return. You can read about it in this link. | 19.50 | 62513.25 | 276.75 | 18432.75 | |
| Apr 18 2012 | 63.14 | Sold 5 Naked Puts Johnson and Johnson stock 18MAY12 $62.50 for .60 cents (status: expired) Comments: To read about this naked put trade select this link. | 13.25 | 31263.25 | 286.75 | 18719.50 | |
| Apr 19 2012 | 62.88 | Sold 10 Naked Puts Johnson and Johnson stock at 18MAY12 $62.50 for $.95 (status: expired) Comments: With continued weakness I couldn’t resist selling 10 more naked puts. All my indicators point to the stock bouncing back up from here. | 19.50 | 62513.25 | 930.50 | 19650.00 | |
| May 2 2012 | 65.00 | Sold 1000 shares of Johnson and Johnson stock at $65.00 Comments: With the rise in the stock the market timing technical tools I use show that the rise is drawing to a close. My goal was $65. I therefore sold. | 7.00 | 64993.00 | 1236.00 | 20886.00 | |
| May 18 2012 | 63.35 | May Options Expiry: $62.50 Naked Puts Expired | |||||
| May 23 2012 | 62.90 | Sold 5 Naked Puts 16JUN12 $62.50 for .68 Status: Expire | 13.25 | 31263.25 | 326.75 | 21212.75 | |
| May 25 2012 | 62.55 | Sold 5 Naked Puts 21July12 $60 for .65 Status: BTC for .04 Comments: To read about this trade and the $62.50 put trade below, select this link. | 13.25 | 30013.25 | 311.75 | 21524.50 | |
| May 25 2012 | 62.55 | Sold 5 Naked Puts 21JUL12 $62.50 for $1.35 Status: BTC for .08 | 13.25 | 31263.25 | 661.75 | 22186.25 | |
| Jun 1 2012 | 61.80 | Bought 500 shares of Johnson and Johnson stock at $61.80 | 7.00 | (30907.00) | |||
| June 1 2012 | 61.80 | Sold 5 Naked Puts 21JUL12 $62.50 for $1.55 Status: BTC for .08 cents | 13.25 | 31263.25 | 761.75 | 22948.00 | |
| June 15 2012 | 66.01 | June Options Expiry: $62.50 puts expired | 22948.00 | ||||
| June 19 2012 | 66.72 | Bought to close 10 Naked Puts 21JUL12 $62.50 for .08 cents | 19.50 | (99.50) | 22848.50 | ||
| June 19 2012 | 66.72 | Bought to close 5 Naked Puts Johnson and Johnson Stock 21JUL12 $60 for .04 cents | 13.25 | (33.25) | 22815.25 | ||
| June 19 2012 | 66.75 | Sold 500 shares of Johnson and Johnson stock | 7.00 | 33,368.00 | 2461.00 | 25276.25 | |
| Aug 8 2012 | 68.25 | Sold 5 Johnson and Johnson Stock Naked Puts 22SEP12 $67.50 for .97 (status: expired) Comments: To understand why I sold JNJ Stock Naked Puts at $67.50 read this article on selling options for income. | 13.25 | 33,763.25 | 471.75 | 25748.00 | |
| Aug 30 2012 | 66.90 | Sold 5 Johnson and Johnson stock Naked Puts 20Oct12 $67.50 for 1.15 (status: expired) | 13.25 | 33,763.25 | 561.75 | 26309.75 | |
| Sep 21 2012 | 69.06 | Sept Options Expiry – Johnson and Johnson Naked Puts $67.50 expired | |||||
| Oct 9 2012 | 68.15 | Sold 10 Johnson and Johnson stock Naked Puts 20OCT12 $67.50 for .36 (status: expired) | 19.50 | 33,763.25 | 340.50 | 26650.25 | |
| Oct 11 2012 | 67.90 | Sold 10 Johnson and Johnson stock Naked Puts 17NOV12 $67.50 for .78 (status: expired) | 19.50 | 67,519.50 | 760.50 | 27410.75 | |
| Oct 16 2012 | 69.36 | BTC 3 naked puts Johnson and Johnson Stock Jan 2013 $57.50 for .04 | 10.75 | (22.75) | 27388.00 | ||
| Oct 19 2012 | 71.86 | October Options Expiry $67.50 naked puts expired | |||||
| Nov 17 2012 | 69.19 | November Options Expiry $67.50 puts expired | |||||
| Nov 28 2012 | 68.75 | Sold 5 Johnson and Johnson Stock Naked Puts 22DEC12 $67.50 for .52 (note change in commission rate) (status: expired) | 10.00 | 33760.00 | 250.00 | 27638.00 | |
| Dec 21 | 70.27 | December Options Expiry $67.50 puts expired | |||||
| Dec 31 2012 | 69.22 | Bought 500 shares at $69.22 using the Bollinger Bands Strategy Trade Comments: To understand this trade read this article. | 5.00 | 34615.00 | |||
| Dec 31 2012 | 69.22 | Sold 5 naked puts Johnson and Johnson Stock 16MAR13 $67.50 for $1.05 Comments: To understand this trade read this article. | 10.00 | 33763.25 | 515.00 | 28153.00 | |

