JNJ Stock is one of those long-term favorites of thousands of investors around the world. There are lots of other stocks just like JNJ Stock and each one of them has a historic stock chart which investors should consider taking some time to read. Just like an exciting spy novel, engaging murder mystery or sweeping romance, stocks like JNJ Stock have historic charts with exceptional stories to tell anyone who wants to read it.
Throughout the story being told, there are terrific bull market rallies and nail-biting bear markets. For my reading pleasure I prefer the bear markets because they tell me as an investor what I might look forward to if I decide to put some of my capital to work in the stock. Let’s take a look at JNJ Stock and the lessons we can learn from the bear market part of their historic chart.
JNJ Stock – What The Bear Markets Can Tell Investors
JNJ Stock – 1992: Loss 36.5%
When skimming through the historic novel of JNJ Stock, the first period I came across was the sideways market of 1992. In January 1992 the S&P 500 commenced the year at 419.34 and by Oct 1993, the S&P500 was at 402.66. From there the market began a climb but it left JNJ Stock behind. The sideways markets which lasted 10 months was not kind to a lot of stocks and by July 1993 JNJ Stock has lost 36.5% of its value before the carnage ended and JNJ Stock recovered.
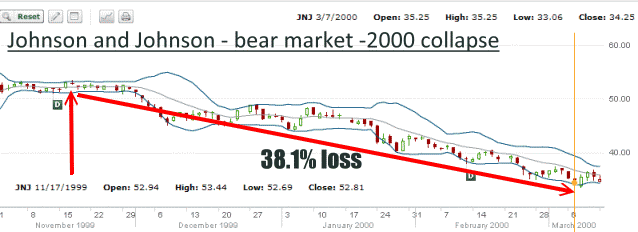
JNJ Stock – 2000: Loss 38.1%
The bear market that started in late 1999 took down many stocks include JNJ Stock which fell 38.1% in 4 months before recovering.
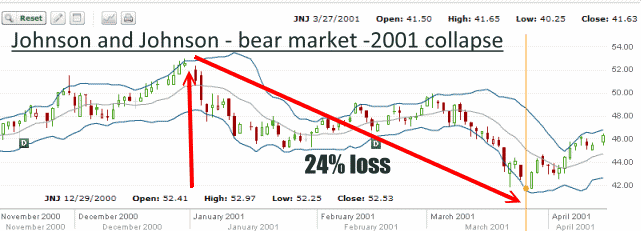
JNJ Stock – 2001: Loss 24%
The bear market that commenced in 2000 lasted right through to 2003. In 2001 commencing in January, JNJ Stock fell 24% until the end of March when the stock again began a recovery.
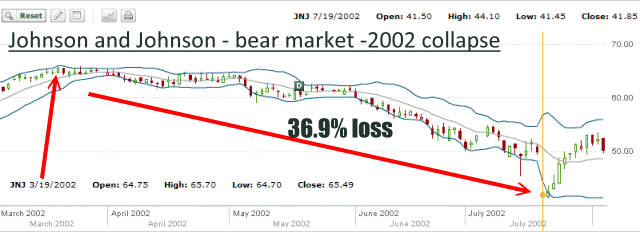
JNJ Stock – 2002: Loss 36.9%
The following year 2002 JNJ Stock lost 36.9% from March until July.
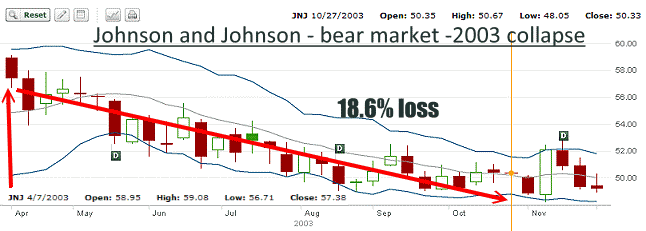
JNJ Stock – 2003: Loss 18.6%
By 2003 a lot of investors were giving up on stocks. From April to October 2003 JNJ Stock lost 18.6%.
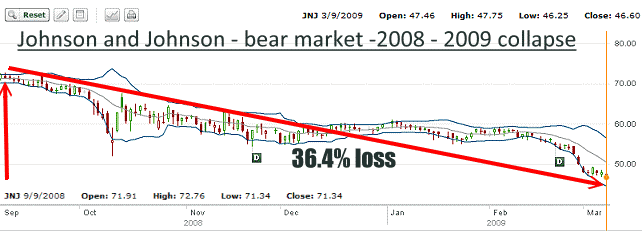
JNJ Stock – 2008-2009: Loss 36.4%
The most recent bear market saw JNJ Stock lose 36.4% of its value between Sep 2008 to March 2009.
JNJ Stock – What The Story Tells Investors
All the above bear markets and severe corrections have an interesting story to tell investors if they take a moment to look at it. The largest loss during the past 19 years was in 2000 when the stock lost about 38% of its value.
However looking at all the losses there are striking similarities.
1992 – 36.5% – 22 months
2000 – 38.1% – 5 months
2001 – 24% – 3 months
2002 – 36.9% – 5 months
2003 – 18.6% – 7 months
2008/ 09 – 36.4% – 7 months
Leaving aside 2001 and 2003 and the worst year 2000, it becomes obvious that in the bear markets, JNJ stock lost roughly 36%.
Looking at JNJ Stock today (Oct 11 2011) the stock closed at $63.96. A loss of 36% would place the stock price $23.00 lower at $40.96.
Looking at the time periods, if we drop the 22 months of 1992 and the 3 months of 2001, the average length of time is 6 months. Since on average a decline could take up to 6 months, this gives the investor enough time to consider some trade strategies:
A) Buy stock and sell deep in the money covered calls, 3 months out and be ready to buy them back and roll them out and lower if the stock falls to the covered call strike sold.
B) Sell puts to try to pick up the stock cheaply sometime in the future, in the event that the markets should enter a more severe bear market than presently being experienced.
C) Consider buying puts at low strike levels at low premiums, if the investor believes the market could fall in the next few months. Buying puts cheaply could make a lot of sense if the investor feels the markets could tumble, which would take JNJ Stock with it.
JNJ Stock – Each of the strategies reviewed as of Oct 11 2011
A) Buy stock and deep in the money calls. The stock closed today at $63.96. Today the Jan 2012 $55 strike could be sold for $9.45. This gives just a 0.89% return.However combined with the .57 November dividend, the return is 1.9%.
If the markets become unstable and begin to collapse, the investor would buy back the covered call as soon as the $55 strike is reached and roll out and lower.
Based on a 36% decline, the investor could consider buying back the $55 strike and rolling to $45.00 and out another 3 months. At $45.00 this would place the investor just $4.00 above the perceived bear market low on JNJ Stock of $40.96. At the $45.00 strike it would be more than possible for an investor to sell covered calls with the stock trading at $40.96.
By carefully watching the call premium and rolling ahead of dividend payouts, an investor should be able to roll their shares and keep the dividend as well. By staying deep in the money with covered calls and rolling ahead of dividend payouts, an investor could receive the $2.28 dividend for the year and earn possibly $1.50 for selling covered calls 4 months out, 3 times in a year. This would bring a total return of 6.8% based on the $55 strike. 6.8% is better than bonds or fixed income investments.
As well when the stock does recover, the investor can roll back up and continue to earn the dividend.
B) Selling puts would be my strategy of choice for JNJ Stock in the event of a severe decline. Presently the Jan 2012 $55 put can be sold for .87 for a 1.5% return. If the stock should experience a collapse, the investor can buy back the sold puts and roll down and further out for more premium. In a stock market collapse volatility will rise dramatically and push up option premiums, puts in particular.
At the same time if JNJ stock should not collapse, the investor could attempt to repeat the trade 3 more times during the year. At 1.5% each time puts are sold, the investor would earn 4.5% for a very conservative trade and a better return than bonds.
C) The last strategy would not be my choice but many investors enjoy speculating on possible stock corrections.
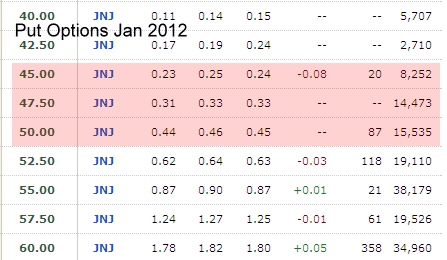
Below are the JNJ Stock put options for Jan 2012 as of Oct 11 2011. Those investors who love to speculate may consider the options I have highlighted in pink since all of them would fall into a 36% correction. In a severe correction these valuation would more than triple quickly as stocks plummet.
JNJ Stock – Conclusion Of What The Bear Market Tells Investors
JNJ Stock is just one example of how investors can look back through the story book of a stock’s history and learn how to invest in the stock for both profit and protection. This JNJ Stock link will take you to google finance where you can look at the past years in Johnson and Johnson stock. For investors worried about the next downturn in the markets, reading the compelling story of stocks like JNJ Stock makes a lot of sense.


