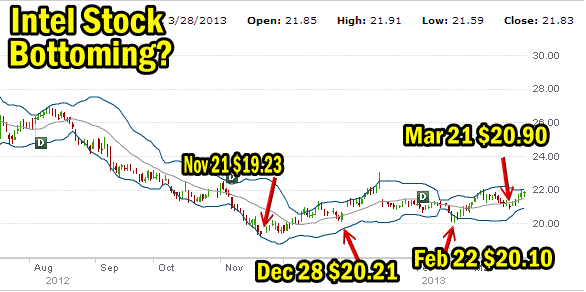
The recent jump in Intel Stock has a lot of investors buzzing. Intel stock trades on the NASDAQ and its symbol is INTC. Intel stock is a giant in the tech world and was badly mauled last fall when Intel stock fell from an intraday high of $29.27 set May 2 to a low of $19.23 on November 21. This marked a loss of 34% and left a lot of investors wondering what happened to Intel Stock. The fear that the PC market was drying up due to tablets and smartphones caught a lot of investors by surprise and selling quickly swamped Intel Stock. I am still holding naked puts as high as $26 on Intel Stock from that time period. You can review my Intel Stock 2012 trades here.
Since then Intel Stock has been stuck in a sideways pattern, or so a lot of investors seem to think.
Intel Stock Daily Stock Chart
If however we look at the chart of Intel Stock you can see that this pattern is probably a bottoming process and in my opinion I believe Intel Stock is preparing to move higher from here. On Feb 22 the move back to a lower low than Dec 28 can often be seen as a retest for a bottom before moving higher. Indeed only in November did the stock fall below $20.00. Since then Intel Stock has put in place a typical recovery pattern.

Is Intel Stock putting in a bottom here?
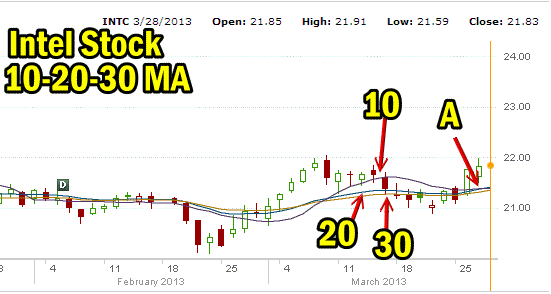
Intel Stock Moving Averages Strategy
Meanwhile if we look at Intel Stock and put in place the 10-20-30 moving averages trading strategy we get an interesting picture. The recent pull back in Intel Stock did pull back the 10 day simple moving average (SMA) but as of Friday March 28, which I have marked as point A, the 10 day has failed to cross the 20 day or 30 day exponential moving averages (EMA) which would signal that we should expect the stock to fall lower. Instead with the 10 day SMA failing to cross over and down the 20 and 30 day EMA it is signaling strength in the stock and a probably move further to the upside.

Intel Stock as seen by the 10-20-30 moving averages strategy
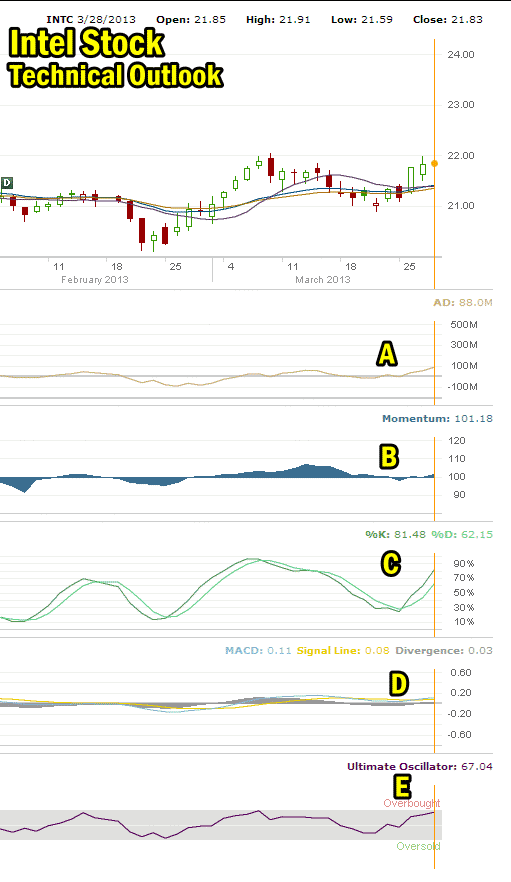
Intel Stock Technical Outlook
Last, let’s look at the technical analysis for Intel Stock. If you look at the chart below you can see the present readings.
A. Accumulation / Distribution has been rising over just the past couple of days. While this is a good sign it is more a sign of traders setting themselves up for a possible rise in Intel Stock. To conjecture, many institutions perhaps are already in the stock at various price points from the past and have probably not added to their shares over the past couple of weeks.
B. Momentum is still up although certainly not roaring ahead.
C. The Slow Stochastic is overbought but signaling that the stock will be higher next week.
D. MACD is practically flat but it is not signaling sell so that could be considered a good sign as well.
E. The Ultimate Oscillator is overbought but not extreme leaving room for the stock to climb higher.

Intel Stock technical outlook as of March 28 2013
Intel Stock Outlook for Next Week
I am holding a lot of naked puts on Intel Stock and I bought 1000 shares at $21.35. Originally I had held calls into May and I had sold May $19 puts to pay for the calls. While this was an excellent trade it also meant that I was holding $47500 of capital to secure the $19 puts. As this was a trade to bring in as big an income as I could dollar wise, I sold the calls on Friday and bought back the puts for a gain and applied the capital that was being held to secure the puts into buying actual stock on the 26th. This is because even with 20 call contracts should my capital even triple in amount it still would not provide $1000 of actual income though the percent return would have been terrific. Instead by holding 1000 shares should the stock get to over $22.00 or $22.50 my income would have been higher and that is what I was aiming for. However I then sold my stock on the 28th the same day as closing the calls because the stock shot up and hit the Upper Bollinger Band and per my Bollinger Bands Strategy Trade that ends my trade in the stock.
I like Intel Stock here. Should it pull back I will buy it again on the next move to the Lower Bollinger Band. I think at $21.00 Intel Stock is very undervalued but stocks can stay undervalued for a long-time if investors are worried about the outlook.
Intel Stock Upcoming Earnings
On or about April 14 Intel should release their earnings for the quarter. Analysts are on average looking for .42 cents per share on $12.7 billion income. Last year the same quarter produced .53 cents per share so this is quite the reduction. Should Intel beat the estimates the stock will definitely move higher from where it closed on Friday, but if Intel fails to beat the earnings I would expect Intel Stock to fall further.
Without a better crystal ball I have to go with personal judgement and I like Intel Stock at this level. I believe there is enough strength here for Intel Stock to push higher but it still must climb higher to capture the 200 day EMA which often signals a true end to a downturn. On Friday though, Intel Stock pulled back to the 100 day and then closed above it another sign of strength.
I think Intel Stock has enough strength here that it will move higher into the earnings announcement in the next two weeks. If it pulls back however I can pick up stock again should it reach the Lower Bollinger Band once more. For Put Selling I like the $21 and of course the $20 naked put strikes but the premiums on the $20 are not great.
Internal Intel Stock Links
Members Only Articles On Intel Stock
Review 2013 Intel Stock Trades
Review 2012 Intel Stock Trades
Review 2011 Intel Stock Trades
Review 2010 Intel Stock Trades
All Intel Stock Posts With Excerpts
External Intel Stock Links

