Intel Stock entered my online portfolio in 2010. The returns has been outstanding. Intel Stock symbol is INTC. Intel Stock trades on the NASDAQ and it needs no introduction. It is widely held by institutional and retail investors. Last year the dividend was increased to 90 cents annually. I am expected another increase this year. Intel is the world leader in micro-chip development, research and distribution. No one can compare to the market dominance that Intel has. This company is well-managed and has for many years traded in an very tight range making it ideal for Put Selling and the odd stock trade. I have no long-term interest in the stock, just Put Selling against it. Intel is the principal player in almost every aspect of communications and technology equipment.
Recalling Intel Stock In 2012
In 2012 the return was just 10% as the stock collapsed in September and left about $100,000 of my capital at risk of assignment. I stayed ahead of assignment and simply kept rolling my puts forward and rolled a few down but primarily stayed focused on moving forward. 2013 proved my strategy right as the stock recovered and pushed higher leaving all my naked puts out of the money and all expired with huge profits.
Intel Stock Profits were 18.6% in 2013
In 2013 the profits were better with a return of $6999.00 against capital in use of $37437.00. This provided an annual return of 18.6%. I do not include the stock I purchase at the end of the year which is being held against the Bollinger Bands Strategy Trade which I commenced. I am expecting the stock to push above $26 in 2014 as this company is very undervalued in my opinion, based on revenue potential, revenue at present and its dominance of its industrial sector. That said, this will still be a short trade which I will close sometime early in 2014.
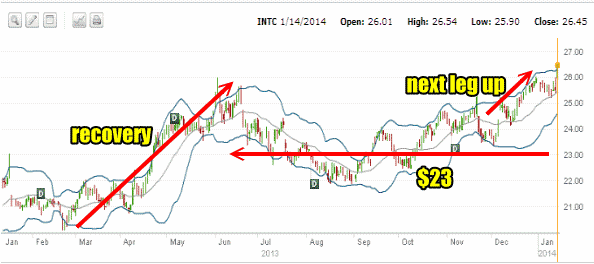
Intel Stock Daily Chart in 2013
Below is the chart from 2013. You can see the recovery in the stock which started in March. The first leg up in the stock ended in early summer 2013. From there I primarily was Put Selling the $23 put strike. A second leg up started in December and will mean a shift to the $24 and then the $25 put strike.

Intel Stock chart for 2013
Intel Stock (INTC Stock) Investment Strategy For 2014
In 2014 I am expecting no changes in my strategy. 2013 saw my recovery from the collapse of the stock and the strategy I applied in 2013 to start the year worked incredibly well. All in the money puts expired out of the money and none lost capital. All trades were profitable in 2013. I will once again be focusing on just two aspects of the stock. I will be selling put options as the primarily income generating strategy. The secondary strategy with be the continued use of the Bollinger Bands Strategy Trade which you can review through this article.
2014 Outlook for Intel Stock
For 2014 I am expecting Intel Stock will move higher and establish a higher trading range. I do not expect the stock will fall back to $20.00 or lower in 2014 based primarily on the earnings growth I am expecting for the stock.
Intel Stock (INTC Stock) Trades For 2014 – Year 5 | |||||||
| Intel Stock (INTC Stock) TRADE STATS: Capital Currently In Use: $49,192.00 Income Earned in 2014: $0.00 Total Income Earned Since Trade Started In 2010: $30226.75 Total Of My Own Capital Required If All Naked Puts Were Assigned: $18,965.25 Number of Shares If All Naked Puts Were Assigned: 2700 Share Price Valuation(Total Capital Required/Number of shares): $7.02 | |||||||
| REVIEW PRIOR YEARS: | |||||||
| Review Intel Stock Trades For 2014 | |||||||
| Review Intel Stock Trades For 2013 | |||||||
| Review Intel Stock Trades For 2012 | |||||||
| Review Intel Stock Trades For 2011 | |||||||
| Review Intel Stock Trades For 2010 | |||||||
| REVIEW PORTFOLIOS: | |||||||
| Review All Portfolios for US Stocks | |||||||
| Review All Portfolios for Canada Stocks | |||||||
| Review All Retirement Portfolios | |||||||
| SELECT TO REVIEW ALL MY STOCKS | |||||||
| Date | Stock At Time Of Trade | Action Taken (All Figures Are US Dollars) ACTIVE TRADES ARE HIGHLIGHTED Commission is $1.00 per option contract plus $5.00 per trade | Comm. | Shares Held | Capital In Use | Gain/Loss | Total Income |
| Below are the remaining Trades from 2013 which I was holding at the start of 2014 | |||||||
| Aug 27 13 | 22.02 | STO 4 naked puts Intel Stock 17JAN15 $18 for $1.21 | 9.00 | 7209.00 | 475.00 | 28861.75 | |
| Aug 27 13 | 22.02 | Sell To Open (STO) Put Selling 3 Intel Stock Naked Puts 19APR14 $24 Strike for $3.10 | 8.00 | 7208.00 | 922.00 | 29220.75 | |
| Nov 22 13 | 23.93 | Sell to Open 5 Naked Puts Intel Stock for 18JAN14 $23 put strike for 0.40 Comments: Trade alert on this trade is here. Article discussing the collapse in Intel Stock and the cash cushion strategy. | 10.00 | 11510.00 | 190.00 | 29721.75 | |
| Nov 25 13 | 23.59 | Sell to Open 5 Naked puts Intel Stock for 18JAN14 $23 for $.51 Comments: Following the cash cushion strategy this is the second group of 5 naked puts at 25% more in put premium than what I earned on Nov 22. | 10.00 | 11510.00 | 245.00 | 29966.75 | |
| Dec 3 13 | 23.50 | Sell to Open 5 Naked Puts Intel Stock 10JAN14 $23 for .54 | 10.00 | 11510.00 | 260.00 | 30226.75 | |
| Dec 3 13 | 23.50 | Bought 500 shares of Intel Stock against Bollinger Bands Strategy Trade | 5.00 | (11755.00) | |||
| The above are the remaining trades from 2013. The return for 2013 was 18.6%. From 2013 in the trades above you can see I am holding 1 set of leap puts for Jan 2015 and 1 set of naked puts at $24 which do not expire until April 2014. The April 2014 puts are using the Walk That Profit Home To Momma Strategy which you can study here. | |||||||
| All Intel Stock Trades Below Are in 2014 Commission $1.00 per contract + $5.00 per trade | |||||||
Intel Stock Internal LinksReview Intel Stock Trades for 2014 Review Intel Stock Trades For 2013 Review Intel Stock Trades For 2012 Review Intel Stock Trades For 2011 Review Intel Stock Trades For 2010 Review all articles about Intel Stock Review Intel Stock Articles Index Review all Members only articles about Intel Stock Intel Stock External Links | |||||||

