Exxon Stock remains highly volatile and I have had some excellent trades these past three months. Exxon Stock trades on New York under the symbol XOM. XOM Stock is a member of the DOW 30. As next week approaches my $87.50 and $85 puts for April 20 look set to expire. I am probably going to close my April 20 $85 puts as soon as they fall below 5 cents which I expect on Monday as I am hoping to sell puts on the 18MAR13 $85 naked puts at $.95 and $1.00. On Monday April 8 with Exxon Stock down to $88.20 I sold the May 18 options expiry $85 puts for .90 cents. I do think the US Dollar will pressure oil and as such Exxon Mobil Stock should pull back making the $85 even more attractive for May. Plus May tends to be weak month for stocks so I am looking forward to good premiums from Exxon Mobil Stock.
Exxon Mobil Stock – One Year Chart
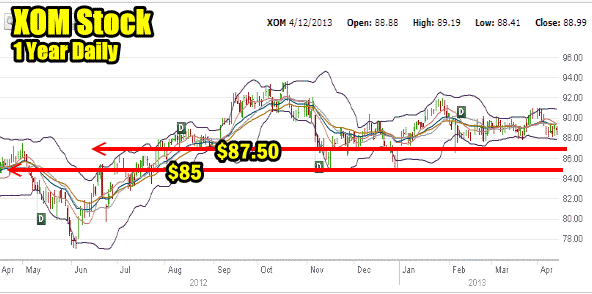
Looking at the one year chart in Exxon Stock you can see that $87.50 has quite a lot of support. I still prefer to be Put Selling the $85 put strike though as it is just far enough out that should the stock pull back I can buy back my $85 put strike and roll out in time and lower. I would own Exxon Stock back around $80.00 so I will be avoiding assignment above that strike price.
If you look at the one year stock chart below you can see that Exxon fell into May and June last year and then rallied through until October. Since then Exxon Stock has been trading sideways with one failed rally attempt. The stock looks poised to fall further going into May so those investors who never want to own stock may want to stay away from Exxon Stock. For myself I like Exxon Stock and have had great success through all the ups and downs in the stock.

Exxon Stock – 3 Month Daily Chart
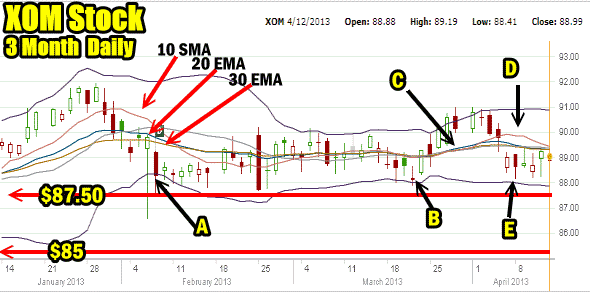
The three-month chart shows why since January I have had such great success with Exxon Stock. I have used the 10-20-30 moving average strategy for quite some time in Exxon Stock to pinpoint when to sell puts and I am using the Bollinger Bands Strategy Trade for quick bounce backs in the stock. A few things worth pointing out.
A. The Bollinger Bands Strategy Trade has been very successful so far this year. Buying at the Lower Bollinger Band and selling at the Upper Bollinger Band has paid very good returns.
B. This was the last Bollinger Bands Strategy Trade that I did and I have since stopped. Point C shows that the 10-20-30 moving averages strategy is no longer giving clear signals. At point D the 10-20-30 was signaling a possible move lower in the stock. At Point E I might have considered one more Bollinger Bands Strategy Trade but the candlestick did not break to the extreme by touching the Lower Bollinger Band. This may be nothing, but the trend right now has stayed sideways and the 10-20-30 is still looking like it may signal stock down. Instead on Monday April 8 which is at point E, I sold naked puts for May at the $85 put strike.
You can see in the 3 month chart below that Exxon Stock has not broken the $85 level at all and only once did it touch the $87.50 level, but the stock keeps pulling back close enough to the $87.50 level that I had made very good premiums on the $87.50 naked puts and then about 1% on the $85 naked put.

Exxon Stock Trade Idea Summary
Between Put Selling both the $87.50 and the $85 puts this year the return on the Put Selling has been almost 2% a month with very little effort. Exxon Stock has stayed range bound for much of the past 3 months and the profits have been excellent. I believe that is about to change for Exxon Stock as we enter May.
The spring months have tended to be soft for Exxon Stock and I do not expect this spring to be any different. Therefore while I am already holding 5 naked puts at May 18 options expiry at the $85 strike, I have a lot of cash I can apply to Exxon Stock should it pull back further in the next couple of weeks which is why I did up this Exxon Stock trade idea.

