Coca Cola Stock has been trending sideways since mid-April eventually entering into a Bollinger Bands Squeeze. The longer it stayed in a sideways pattern the tighter the Bollinger Bands Squeeze was formed. With big cap stocks it’s always a toss up whether the Bollinger Bands Squeeze will result in a breakout to the upside or a pull-back. There are of course clues that can be followed but this article instead is focused on establishing a Put Selling ladder against Coca Cola Stock and using either naked puts with margin or credit put spreads for that ladder.
Coca Cola Stock One Year Daily
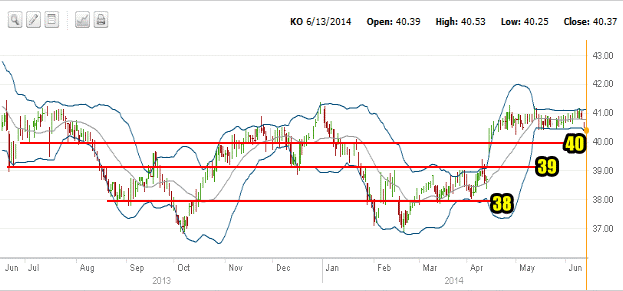
The one year daily chart for Coca Cola Stock below shows us that there are three support levels. $38 and $40 have more support that $39 but all three are decent strikes to consider for Put Selling depending on the investor. Looking at the chart you can see that a natural strategy would be to set up a Put Selling ladder.

KO Stock one year daily chart to June 13 2014
Naked Puts With Margin or Credit Put Spreads
This strategy article looks at two methods for setting up and profiting from using the Put Selling ladder on Coca Cola Stock. The first method looks at naked Put Selling using margin. The second method looks at using a credit put spread strategy in combination with the put ladder strategy.
This article is 2100 words in length and will require 8 pages if printed. No matter which method is used, the Put Selling ladder provides a high degree of safety while generating profits and when used against the weekly options available for Coca Cola Stock, it can generate significant returns.
FullyInformed USA Members can can login directly through this link or Members can sign in to the full USA members site here. Non-members can join here or read the benefits of being a member.
Internal Stock and Option Trades Links
Put Selling Strategies For Members
Covered Calls Strategies For Members
Profit And Income Strategies Index
Stock and Option Strategies For Members
Stock And Option Trades Explained For Members


