Cat Stock is another favorite stock of many investors around the world. It stands to reason because CAT Stock represents a huge international corporation with locations in every major world market. Caterpillar has a market cap of 48 billion and revenue of around 50 billion. This is a mammoth company with ties to the infrastructure growth of nations everywhere.
This is also part of the reason I like to read the story that its historic charts tell me, because CAT Stock is directly tied to the health of the world’s economies. Before I invest in a company such as Caterpillar I need to know what I might expect in the future and once again, it is the novel about Cat Stock and its history that makes for compelling reading.
CAT STOCK – What The Bear Markets Can Tell Investors
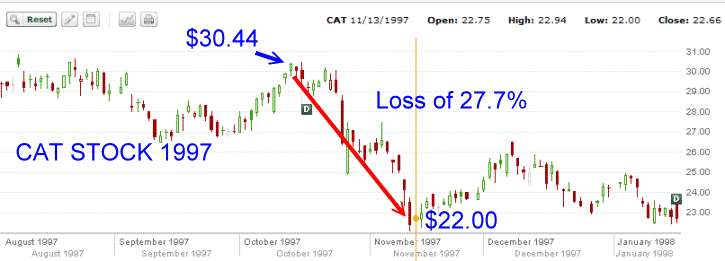
CAT Stock – 1997: Loss 27.7%
In 1997 Cat Stock experienced a 27.7% drop in value in less than 1 month. It was a stunning drop and placed the stock squarely into a bear market.
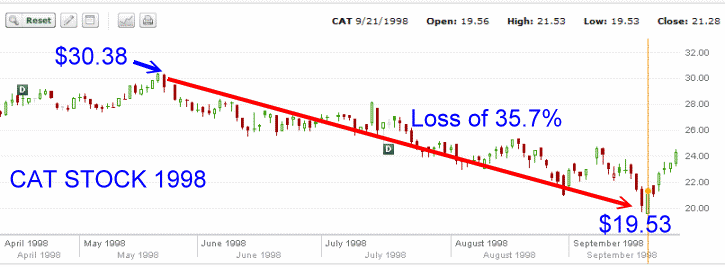
CAT Stock – 1998: Loss 35.7%
The following year the stock recovered by May, only to crash again. By the end of September 1998 the stock had lost 35.7% and placed the stock back in its second bear market in less than a year. The full extent of the crash took 4 months.
CAT Stock – 2000: Loss 46.8%
The following year Cat stock had recovered into the low $30 range and then commenced a downturn which plunged into October 2000. This bear market took 46.8% of share values and lasted 10 months.
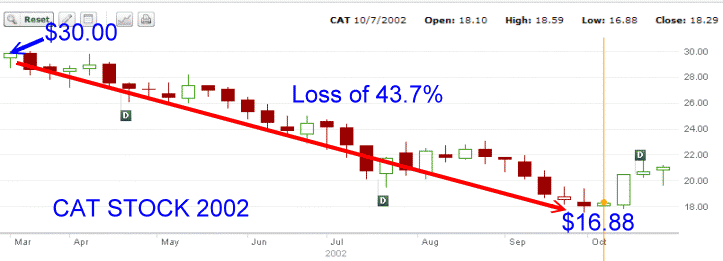
CAT Stock – 2002: Loss 43.7%
The bear market of 2000 to 2003 was tough for investors. By early 2002 Cat Stock had again reached $30.00 only to once more fall over a period 10 months. Almost an exact repeat of 2000, the stock lost 43.7%.
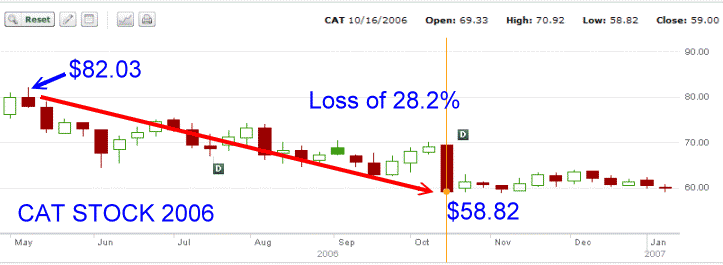
CAT Stock – 2006: Loss 28.2%
From 2003 to 2006 Cat Stock had a number of pullbacks, but all were normal in the course of the growth of a company such as Caterpillar. But in 2006, the stock hit a roadblock when its stock touched $82.00. Five months later the stock had lost 28.2% of its value.
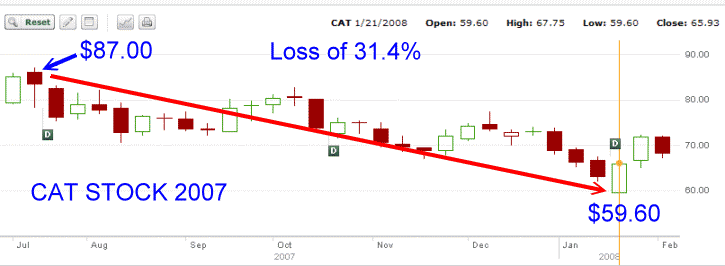
CAT Stock – 2007: Loss 31.4%
By July of the next year, Cat stock had once more recovered only to fall 31.4% over the next 7 months.
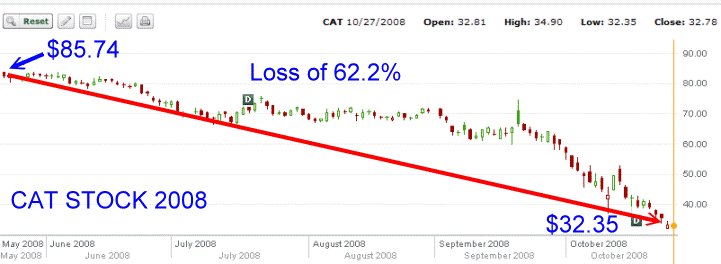
CAT Stock – 2008: Loss 62.2%
The following year Cat Stock almost recovered its 2007 high before it began a collapse that ended up being its worst decline in the stock’s history. A loss of 62.2% over a period of 6 months.
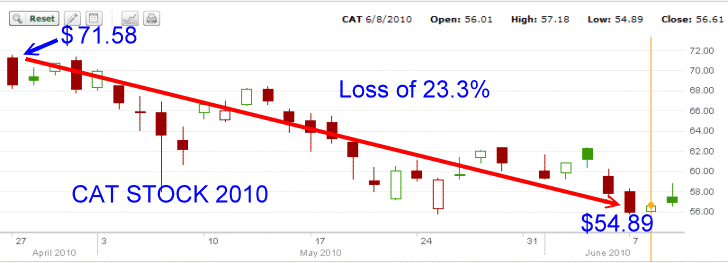
CAT Stock – 2010: Loss 23.3%
The stock recovered throughout 2009 and in April 2010 at a high of $71.58 the stock commenced a decline of 23.3% over a period of 3 months.
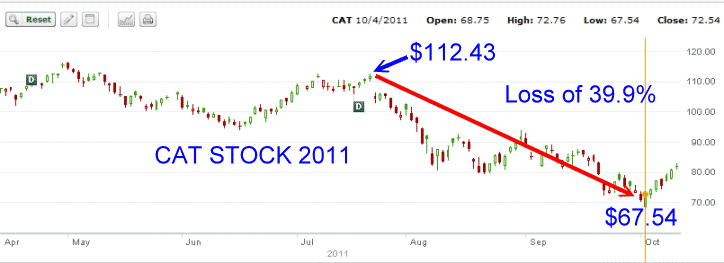
CAT Stock – 2011: Loss 39.9%
This year (2011) the stock made a new all time high. Since July the stock had fallen 39.9% over a period of 4 months.
CAT Stock – What The Story Tells Investors
Just as in the JNJ Stock review, all the above bear markets and severe corrections have an interesting story to tell investors about CAT Stock. The largest loss during the past 14 years was in 2008 when the stock lost 62% of its value.
However looking at all the losses there are striking similarities.
1997 – 27.7% – 1 month
1998 – 35.7% – 4 months
2000 – 46.8% – 10 months
2002 – 43.7% – 10 months
2006 – 28.2% – 5 months
2007 – 31.4% – 7 months
2008 – 62.2% – 6 months
2010 – 23.3% – 3 months
2011 – 39.9% – 4 months
There are a number of things I can learn as an investor in Cat Stock.
1) First and foremost is that the stock is volatile. It is nothing like JNJ Stock. Cat Stock rises and falls much quicker and has limited support until the losses become at least over 25%. This also tells me that after the stock falls and then recovers, it is never worth selling puts against it at higher prices. It is always worth waiting for the stock to fall. As well the volatility in Cat Stock keeps option premiums high, both puts and calls, making option strategies very profitable in both bull and bear markets.
2) Second is that anywhere below 35% should pique my interest to start looking at selling out of the money puts or buying the stock and selling in the money covered calls. Even if I was wrong and the stock was going to fall further than 35%, I have a lot of confidence based on the history of the stock that it will recover and I will have lots of opportunity to sell my shares at higher prices.
3) Third, out of the 9 collapses in the stock (as seen above) , 6 were over 30% and all but one were over 25%. Therefore there is no need to chase this stock. Once a selloff commences such as July of this year (2011), once the stock fell 39.9% by October 4, it was a time to sell out of the money puts or buy the stock either for a bounce or for selling in the money covered calls.
While at 39.9% down, there could easily be more downside, looking at the above collapses in the stock this correction in 2011 is actually once of the more severe. Only 3 other corrections were worse and one 1 a lot worse.
4) There is not a lot I can read into the number of months for each collapse of the stock. Instead I note how after every collapse the stock recovers. This makes Cat Stock a very good candidate for my strategies.
CAT Stock – Strategies To Consider
After the recent downturn and after studying the above information, it is obvious that after Oct 4 when the stock fell almost 40% from its most recent high, it would have been a practical decision to step in and either sell out of the money puts or buy the stock either for a bounce back up or in the money covered calls. Would these strategies have worked?
Strategy: Selling Puts On Cat Stock
On October 4th with the stock at $67.54, the Nov 19 2011 put could have been sold for $2.55 for a return of 4.25%. By selling the $60.00 strike, this afforded an extra 11% downside protection. If Cat Stock fell to $60.00 the stock would have collapsed 50.9% making it the second worst collapse in Caterpillar’s history. This is the trade I would have done on October 4.
Strategy: Selling Deep In The Money Calls Against Cat Stock
On October 4th with the stock at $67.54, the Nov 19 2011 $60 covered call could have been sold for $10.35. This would have provided for a return of 4.68%. At $10.35, this moved the cost basis for the investor to $57.19 and provided 49% protection from the most recent high.
If the investor was not exercised early and captured the October dividend of .44 cents which should be paid out around Oct 21, this would add 0.73% for a total return of 5.41%.
Here are the calculations for the Deep In The Money Call Options (no commissions taken into account)
Bought 500 CAT STOCK shares for $67.54 = ($33770.00) capital laid out to buy the shares
Sold 5 Covered Calls 19NOV11 for $10.35 = 5175.00 income earned from the covered calls
Actual amount of capital in CAT STOCK = ($28595.00) deduct call income from capital outlay
Share price of stock = 500 / $28595.00 = $57.19
CAT STOCK exercised on 19NOV11 at $60 = $30000.00 – return of my capital when exercised
PROFIT EQUALS = $30000 – $28595.00 = $1405.00
RETURN = 1405.00 / $30000 = 4.68%
If Dividend is earned add .44 X 500 = $220.00
Total PROFIT = $1405.00 + $220.00 = $1625.00
Total RETURN = $1625.00 / $30000 = 5.41%
Strategy: Buying Cat Stock Anticipating A Bounce
In keeping with the strategy of just buying Cat Stock on October 4 as it had fallen 39.9%, a bounce could be anticipated and as we have seen, the bounce has taken Cat Stock back to $81.70 for a gain of over 20%.
I think any of the above strategies would have been good strategies to have considered on October 4. If wrong and the stock had fallen further, the first two strategies had extra protection of another 10% and all the strategies have a very good chance that the stock would eventually recover.
Select this link to see the latest quote on Cat Stock. Link goes through an ad first.
For those investors willing to spend some time, the history of a stock makes for terrific reading. The story about Cat Stock is both hair-raising, with its 62% loss in 2008 and spine tingling when an investor realizes at what strike points to consider for purchasing the stock and either selling options or buying for a bounce. Cat stock, with its high volatility, makes an excellent case for investors to consider following the stock and investing during times of stress.
CAT Stock is one of those rare gems that, if traded properly, could produce sizeable profits for investors.


