BMO Stock has been a favorite of mine for decades. While many analysts feel that Bank Of Montreal cannot grow its earnings quickly enough, I have enjoyed annual double-digit returns through a combination of stock ownership, put selling, and buying puts and calls as I trade the pattern that BMO Stock remains stuck in.
Despite excellent earnings for the past quarter that exceeded analysts estimates by a wide margin, the early morning panic on Wed May 23 hit BMO Stock harder than I anticipated. I follow only a handful of stocks and part of the reason is so that I can take advantage of those handful of stocks when they have a variety of moves. I find there is no reason to be chasing multitudes of stocks and indeed years back when I tried out vectorvest I was amazed at how many stocks investors were busy trying to trade. Vestorvest is a momentum tool. It basically looks at momentum in a stock, compares it to a variety of technical indicators and then determines if there is enough strength in the stock to carry it higher. If there is, it is rated a buy. There is nothing wrong with their formula and it does works. But any investor can easily accomplish the same momentum type trading through selecting their own technical indicators, picking the stocks they want to trade or are comfortable trading and then follow those stocks daily.
I can easily earn my 12% a year by following a handful of stocks, but as regular readers know, I can earn a lot more than 12% a year with the same handful of stocks and sleep nights. Wouldn’t it be great to earn 15% a year off stocks like PepsiCo Stock or Johnson and Johnson Stock or other blue chip stocks? I know that when I was holding a stock like Coca Cola Stock and it lost 54% of its value in a private bear market that trounced Coca Cola Stock from 1998 to 2004, I never once lost sleep. Instead I was trading Coca Cola Stock constantly and earning very good returns even as this stock lost 56.9% of its value over 7 years. If you want to learn more the bear markets that Coca Cola Stock has gone through read this article.
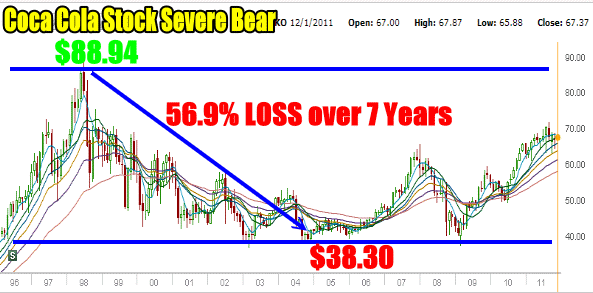
Coca Cola Stocksuffered a Severe Bear Market from 1998 to 2004 during which it lost 56.9% of its value.
Basically then, I believe I can do very well just following a handful of stocks. Let’s look at the BMO Stock trades I did on Wed May 23 and explain why I did the trades I did.
BMO Stock Buying For A Quick Bounce
As explained above, I watch a handful of stocks. BMO Stock is definitely one of them. I was expecting earnings to be good, possibly because so many analysts were not and I tend to look beyond analysts and pick through the numbers from previous quarters. When the numbers were released before the market opened I was looking for a bit of selling just because many investors tend to buy stock in the days leading to the earnings announcements and then after that they sell out. I thought with a bit of luck I might be able to sell naked puts into June for 1%.
Instead investors dumped BMO Stock from the open. On the BMO Stock chart below you can see the huge volume, and heavy selling. Maybe investors didn’t read the numbers right or maybe a fund manager wanted out or maybe investors thought they would hear about a dividend increase and didn’t. Whatever the case within 20 minutes or so BMO Stock had fallen to $54.37 and I had sold 5 naked puts for June at $54 for .75 cents and I bought 1000 shares of BMO Stock for a bounce. I thought the bounce might take a day or two for BMO Stock to rise to $55.50.
However the bounce took place during the day and BMO stock closed above $56.00. I sold my BMO Stock near the close as volume was picking up and I felt that many traders would be dumping their BMO stock. I bought the shares for $54.50 and sold then at $56.00. As this was a 2.7% return for 1 day’s work I figured a lot of other investors were probably doing the same trade. I didn’t want to see the stock fall back with a lot of selling so I sold.
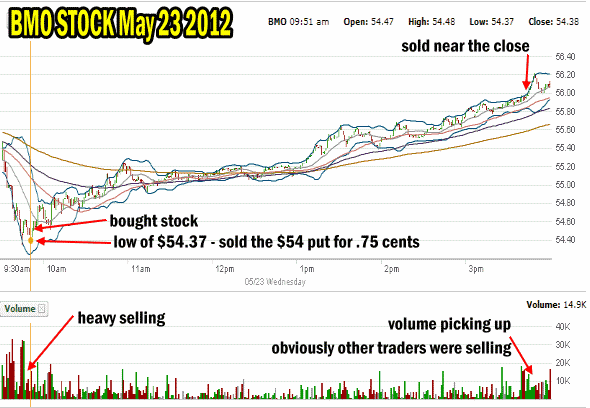
BMO Stock chart for May 23 2012 shows my one day trade
BMO Stock Naked Puts Trade
When I bought my BMO Stock I also sold naked puts at the $54 strike for June options expiry. This had been my expected trade for the day. I did not expect that the stock would fall that low. I was looking for it to slip back to perhaps $55.00 and I had hoped to get .45 cents for the naked puts. Instead I received .75 cents for 1.3%.
How To Decide On Entry for Both The Stock Purchase And Put Selling
Now that I have had the chance to explain all the exciting details of the one day trade, I thought it would be helpful to explain how I knew to buy the stock as well as sell the naked puts as this strategy can be applied to numerous stocks.
Was It A Gutsy Move?
While it might seem that I was savvy, or gutsy or took the gamble or rolled the dice or whatever terms you can think of for this trade, I was anything but. Instead these types of trades come about because I have done my homework months ago on the stock. This is why I love to watch a handful of stocks and trade them. By watching just a few I am always prepared for opportunities.
Below is the one year BMO Stock Chart. Looking at the 1 year chart, you can see that from July 2011 right until December, the stock kept falling back to around $55.00. Then BMO Stock would rise up and hit 60.00 or slightly higher before falling back again.
In December just before the market bounced, BMO Stock fell to $54.50 and then ran up to $61.00 for a gain of roughly 12%. $54.50 obviously is a pretty interesting strike to consider which is what happened on May 23. The stock fell to $54.50 and I immediately bought 1000 shares.
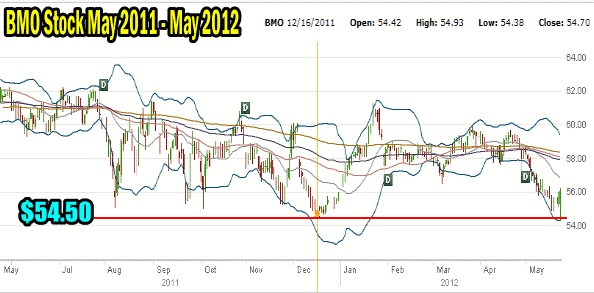
This is the one year BMO Stock chart. Here are the first clues about what strikes to sell and where to buy stock.
BMO Stock Trade For 1 Year. Just How Easy Is It?
You can see that it wasn’t a gutsy move at all to buy on the selling but a move based entirely on homework. So how easy was the past 12 months for trades on BMO Stock? Consider that I did just 3 stock trades on BMO Stock last year. Basically I bought the stock three times at $55.25 and then immediately put in my offer to sell at $60.00. The return on the stock trades last year were 25.5%. and my capital was exposed for only 3 periods.
Add in the naked puts selling I did at $54.00 and you can see that the overall return last year on BMO Stock was over 30%. Now you can understand why I watch only a handful of stocks. The dividend paid by BMO Stock is $2.80. If the stock should tumble past me at either $55.25 where I am holding stock ($2.80 = 5.06% at $55.25) or my naked puts at $54.00 ($2.80 = 5.18% at $54) I am still earning a decent dividend return while waiting for the stock to recover.
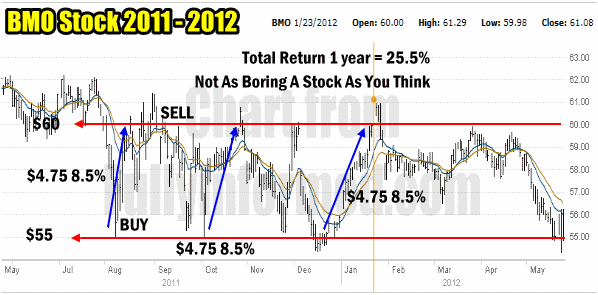
BMO Stock 2011 to 2012 One Year Trade Chart
But Wait, There’s More
There is a lot more to love about this type of pattern trade on BMO Stock. Besides the stock and put selling I also bought naked puts and naked calls on BMO Stock. For example, in the chart below you can see that I did a number of trades which, when the stock was up above $60.00 I would buy the $56 naked put 3 or 4 months out. Then as the stock fell it would quickly grow in value. I would then sell my $56 strike puts and then turn to put selling and sell the $54 put. Next I would buy the $60 call again 3 to 4 months out.
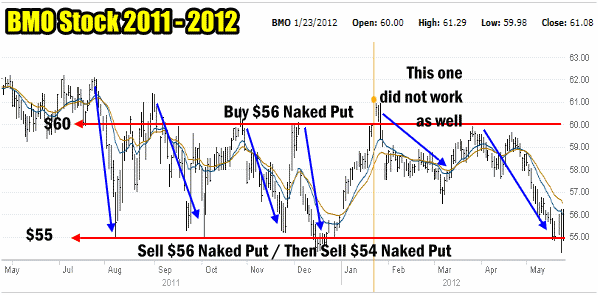
Throughout the year I also bought puts and calls.
For example the first trade was in July 2011 with the stock at $61.98. I bought the Sept $56 puts for .24 cents. Then in August I sold my September $56 puts for $2.70 and then sold the Oct $54 naked puts for $2.40. I then bought Oct $60 calls for $1.19.
In September I sold the Oct $60 calls for $2.39 and bought the Jan $56 puts for $1.50.
I repeated this cycle continuously throughout the above time period doing 10 contracts on BMO Stock each time. You can begin to see why doing homework in advance can make quite the difference in many stocks not just BMO Stock. The purchasing of BMO Stock calls and puts was a low risk trade because the cost of the put is the only capital at risk. I also always make sure I go out several months to give enough time for the trade to work out.
An investor could change this trade and buy the BMO Stock $60 put and then sell it once BMO stock reached $55.00. However that costs more capital and I prefer to spend smaller amounts which means less capital at risk of loss and more capital available for other trades.
BMO Stock Trade Summary
I am sure readers can now understand that nothing in the above BMO Stock trades is gutsy or gambling. I prefer to spend my time examining my favorite stocks and looking for patterns that will provide profit potential. Then it is a matter of matching up the right strategy with the pattern that I see developing.
In the case of BMO Stock, the pattern above has been extremely profitable and I am expecting the next few months to repeat this pattern. Meanwhile there are other stocks which this same strategy and pattern can be applied against. It is only a matter of doing a bit of homework to find those blue chip stocks that exhibit the same pattern styles making this style of trading which I have done in BMO Stock, profitable.

