The last article I wrote on BlackBerry Stock (Research In Motion Stock) was back in January 2013. At that time BBRY Stock was trading around $11.50 and investors were getting excited again and indeed the stock did shoot up to $16.00 by the end of January. The problem I saw was just no reason to stay with the stock any longer. BlackBerry for all the coverage by analysts was dead in the water back in January. It basically was only a matter of time before the company would be torn apart and sold in pieces.
Fairfax Financial Deal Collapse
The collapse of the Fairfax Financial deal to try to buy the company for just over $4 billion was doomed from the start. The value left in this company is really not there. Turning around a company like BlackBerry had to be done along time ago. 2007 would have been a good year to start. By the time Fairfax wanted to buy BlackBerry there was no real value left. With confidence wiped out and the company bleeding in everything from declining subscribers to retail outlets to revenue, this company stands as a perfect example of what poor management can accomplish.
Investors Caught
I have spent the entire day replying to dozens of investors who have emailed wondering what they should be considering doing. Unfortunately there is not a lot to offer. In my comments over the past 2 years I indicated many times that the trade in RIMM or BBRY was over when I stopped trading in May 2011 with the stock struggling to hold $41. By 2011 what few trades I had left were almost all selling naked calls. Selling puts was finished in BBRY and as the stock imploded it was time to sell naked calls.
My final two trades in BBRY Stock can in May 2011 when I sold 5 naked calls for June at $52 for .20 cents and they expired in June with the stock down at $27.24. You can review 2011 trades through this link.
Why Stop Trading BlackBerry Stock
I have received hundreds of emails since June 2011 asking why I no longer traded in BBRY Stock when naked calls seemed so lucrative. It was because of risk to my portfolio. As the stock fell back to $10 and $11 I felt the chance of a bounce back could leave me with shares in a company I had no interest in owning. I only do one speculative stock in my portfolio. Earlier this year it was Facebook Stock and at present it is Lululemon Stock.
When investing for portfolio growth and income, controlling losses are as important as profits. While it is true that during the past two years I could have earned probably 2 percent every month, an investor has to question how much capital they would want to commit to the trade itself. In the case of BlackBerry Stock the amount of capital I was willing to risk was less than even Facebook Stock which must tell you something.
Managing Risk Versus BlackBerry Stock Reward
Managing risk in my portfolio means understanding the risk involved and how much capital can be applied to a trade to make that trade worthwhile. When a trade is put in place I have to follow the trade which takes time. That is often time that can be spent on better trades.
Even earning 2% a month through selling naked calls in BlackBerry Stock makes little sense if I can earn almost the same amount in a big cap dividend payment stock such as McDonalds Stock or Johnson and Johnson Stock or a host of many others and better manage the risk to my capital. YUM Stock itself has paid more than 2% each month. It becomes a question of how much risk to my capital am I willing to accept for the gains that can be made.
With BlackBerry Stock the risk no longer warranted even following the stock or looking for opportunities in it. There are so many opportunities every day in all the stock I follow. Why risk capital in a trade that not only does not meet my criteria but has no real future.
3 Easy Warning Signals Of The BlackBerry Stock Collapse
Today marks another incredible drop as this stock works its way toward shareholder oblivion. So what should shareholders do? The first is to understand that this kind of collapse has literally dozens of warning signs that go back years. Investors must learn to watch for such signals and act on them. Here are the 3 easiest signals investors should have seen.
1) Lower Highs
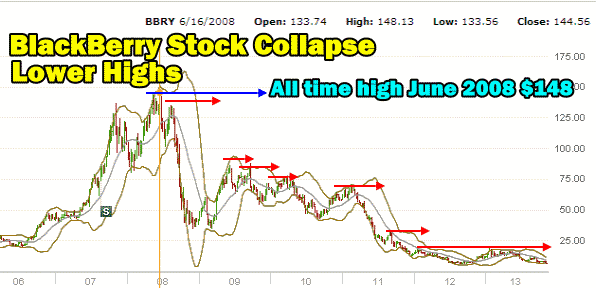
Starting in June 2008 when the stock reached a high of $148, it failed repeatedly to recover the highs. In other words, every single rally back since 2008 failed to recapture the previous highs. This is because investors who are holding shares bought at each of the highs are fearful and when the stock pulls back and then runs up again, previous investors dump their shares to get out of the stock. This means the stock cannot recapture any previous highs. The stock no longer had any investor confidence and as the months past after the highs of June 2008, investors kept getting out of the stock. Losses for investors have been truly staggering. These losses have been felt by professionals as well as retail and institutional investors. Yet the signal of a failure to capture previous highs is so easy to spot. But again investors must act on those signals. Most did not.
So remember the lesson. A stock must recapture the previous highs to show investor confidence. Without previous highs being broken, the stock is simply imploding over the course of many months and years.

2) Inverse Moving Averages
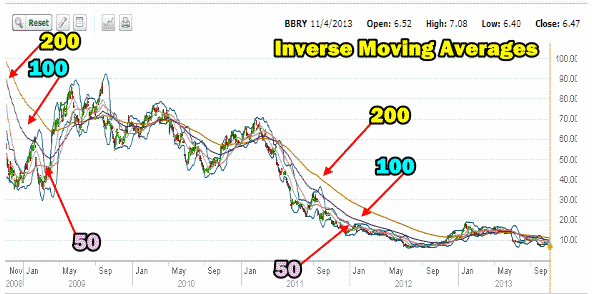
Starting in 2008 the moving averages became inverse. In other words instead of the averages being 50 day simple moving average (SMA) on top, 100 day exponential moving average (EMA) in the middle and 200 day exponential moving average (EMA) on the bottom, the 200 day moving average moved to the top and the 50 day simple moving average (SMA) stayed at the bottom. The inverse condition that existed in BlackBerry Stock was a simple signal that any investor could have followed.
The 200 day exponential moving average (EMA) staying on the top of the moving averages chart pattern is a clear signal that the direction is lower. The 50 day simple moving average (SMA) needs to recover to the top and climb further away from the 100 and 200 day EMAs. The recovery of the 50 day SMA pulls the 100 and 200 day EMA’s higher which signals a possible trend reversal in the stock.
In the case of BlackBerry Stock, the 200 day stayed on the top of the chart pattern, which signaled that the long-term trend continued to be lower for BlackBerry Stock. This again is an easy signal to follow and spot. This signal warned back in 2008 that the uptrend was over and the stock was in trouble. The chart below starts in November 2008 through to the present. You can see how very few times the 50 day tried to recover but always turned back down. The 200 day never wavered in its move lower through this entire period. Again an easy signal to spot.

3) Analysts Recommendation and Media Coverage Hype
The last easy signal to spot on a stock is media coverage and analysts recommendations. For example, below were the analysts recommendations on BlackBerry Stock at the end of October 2013. Twenty analysts still rate the stock a hold. Three are rating it a buy and eleven rate it as under perform. Only four analysts rate BBRY Stock a sell. Even in its most recent report S&P rated BlackBerry Stock a hold and because of the letter of intent with Fairfax they rated the stock’s outlook at be $9.00. This kind of rating is almost pointless for investors to follow.

Throughout the past 5 years analysts have promoted BlackBerry Stock despite every sign that the stock was in a serious decline that looked like a death spiral. Buy recommendations, hype and too much media coverage on a declining stock is a signal that a stock is in serious trouble and should be avoided.
BlackBerry Stock and Why Investors Failed
In the end though, many investors failed with BlackBerry stock because they were unwilling to read the simple signals, act on them and at the least, learn from mistakes. Few took steps necessary to correct their failing trades in BlackBerry Stock quickly before it was too late.
By having a goal when a trade is entered into and then a plan on how to handle the trade, investors can avoid severe losses and know to get out of a stock when the trade turns the wrong way.
For example in early January 2011 when the stock was being promoted heavily and was rising toward $60.00, an investor buying the stock could have set an acceptable loss of perhaps as much as $1.50 on the stock and then as the stock rose toward $64.00 kept adjusting that stop to protect himself and try to lock in profits. As every indication seen above pointed to more collapses in the stock, investors should have know that without a plan they would be placing their capital at a huge risk of loss. A simple stop-loss plan would have saved them from steep losses.
Even selling naked puts in a stock like BlackBerry meant setting an acceptable loss and getting out of the trade should the stock pull back and push up the put premium earned. There was never any sign that BlackBerry Stock was worthy of accepting assignment of shares for any rescue type strategy. Instead an acceptable loss on selling options should have been put in place, or as I mentioned in other articles, a put credit spread would have been a better way to trade if the interest was on the put side of BlackBerry Stock. Even call credit spreads would have been a wiser move.
The Wisest Trade Of All
The wisest trade of all though was to leave BlackBerry stock behind and end all trades. The investing world is filled with thousands of stocks to trade. When one stock fails there are many others to turn to. In the end almost every successful trade comes down to understanding and managing risk. BlackBerry Stock’s collapse and impending demise is yet another example of how few investors understand this concept in investing.
Research In Motion Stock (BlackBerry) Internal Links
Research In Motion Stock 2011 Trades
Research In Motion Stock 2010 Trades
Research In Motion Stock 2009 Trades
Other Research In Motion Stock Articles


