Apple stock closed lower again today but finally technical timing indicators are showing the stock is so heavily oversold that I have sold all but 5 puts and will hold the remaining 5 puts to see if Apple Stock can recover or if the downside action picks up again.
In the Options Forum (plug for the forum) which you can join for free here the debate is raging on about whether technical analysis works or not. Everyone knows which side of the fence I am on when it comes to technical analysis. I am a big believer after 35 years of using a variety of technical indicators. But perhaps the problem isn’t technical analysis itself but instead the investors who attempt to use it.
Apple Stock and Technical Analysis Failure
Let’s look at Apple Stock. I have written a number of articles on Apple Stock recently including an article pointing out why so many stock and financial analysts were sucked into Apple Stock as it continue to collapse. Technically speaking all the technical analysis in the world showed investors that the stock was collapsing.
Let’s review just three technical indicators that ANY investor could use on stocks.
Ultimate Oscillator and Apple Stock Sell Signal
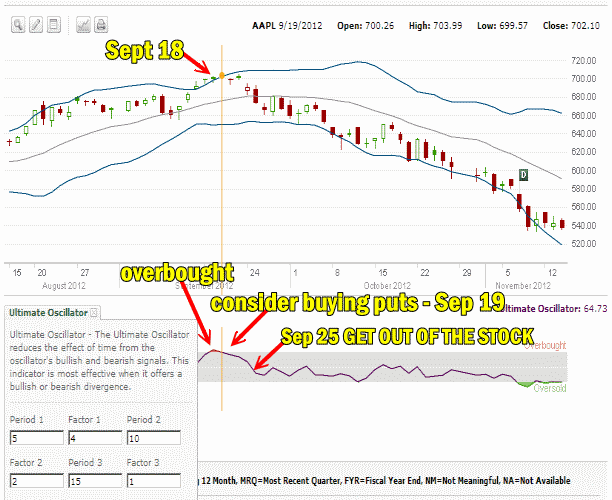
On September 18 as Apple Stock pushed toward $700 and investment analysts “Upgraded” the outlook for Apple Stock and were talking about $1200 for the stock by Christmas, the Ultimate Oscillator flashed an overbought signal.
The following day on September 19 the Ultimate Oscillator turned down. For interested investors who love options, the signal was to buy puts. On September 25 the Ultimate Oscillator fell into negative readings signaling that it was time to get out of Apple Stock.
Below in the 3 month Apple Stock chart are my settings for the Ultimate Oscillator, however even the default settings were giving the same signals.

Ultimate Oscillator warned more than once that investors should get out of Apple Stock.
MACD and Apple Stock Sell Signal
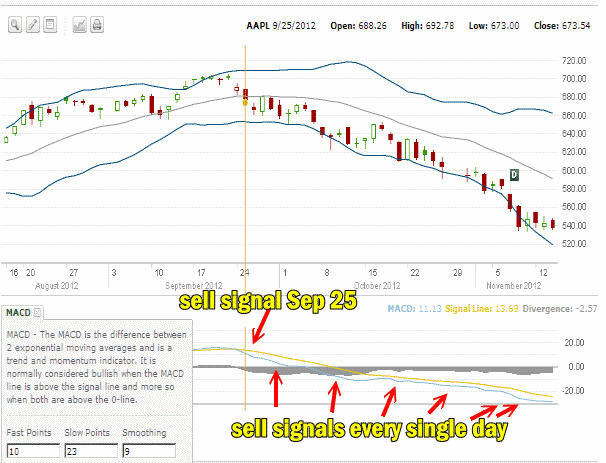
MACD or Moving Average Convergence / Divergence issued the first sell signal on September 25 2012. This was the same day that the Ultimate Oscillator indicated to GET OUT of Apple Stock. Apple Stock opened at $688. Today Apple Stock closed at $536.88 or 21.9% lower. Any investor could have sold out on September 25. Every single day following that sell signal MACD kept flashing a sell signal. Every little rally in Apple Stock was met by MACD still flashing “SELL”. Finally today MACD is beginning to turn flat after weeks of selling. My settings for MACD are in the chart below. Why did so many investors fail to heed the MACD Sell Signal?

Apple Stock and MACD sell signals
Slow Stochastic and Apple Stock Sell Signal
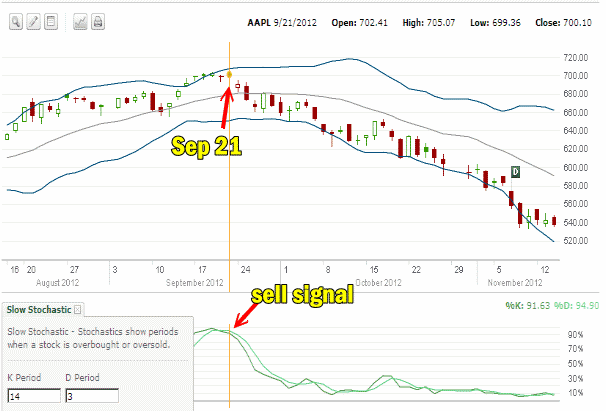
The third technical timing tool is the Slow Stochastic. On September 21 the Slow Stochastic issued a sell signal. Every day until October 3 it flashed the same sell signal. Since then any change in trend has not been confirmed back up by the Slow Stochastic until finally now the slow stochastic has turned extremely oversold and gone flat.

Slow Stochastic Sell Signal on Apple Stock
Technical Analysis Failure? Doubt It
So did Technical Analysis fail investors on the recent collapse of Apple Stock? I don’t think so but I am surprised at how few investors acted upon the sell signals.
Here is what I saw in my charts above and what I did:
Sept 19 – Ultimate oscillator flashes overbought and turns down – time to consider buying puts. I bought 10 puts out to January 2013.
Sept 21 – Slow Stochastic flashes sell which means either get rid of your Apple Stock or buy protection. I doubled my puts on Apple stock from 10 to 20.
Sept 25 – MACD signals down Ultimate Oscillator signaled get out of the stock. I tripled my puts on Apple Stock from 20 to 30.
Three technical indicators all confirming each other. Technical analysis is not rocket science but is based on sound principles of investing including volumes, momentum, sentiment and volatility.
I often wonder how many investors can honestly say that they follow technical tools every single day. How many investors actually pick their basket of stocks and then plot the technical indicators to know when to get in and when to get out? How many investors ease their way into a trade such as the one above and ease out of it based on what the technical indicators advise?
Investors Not Technical Analysis Are Often to Blame
From September 27 to Oct 9 I received 377 emails from investors asking me what I thought they should do with their Apple Stock. Most had bought Apple Stock between $640 to $685.
To those 377 who wrote me I sent the technical analysis charts similar to the above and indicated that while I could not offer direct investing advice because I am not a financial planner or advisor and everyone trades at their own risk, I could tell them that if I was holding stock I would be out of it and I would be buying puts. I explained that I had bought puts per the dates above and the strategy I was using. I explained to them that I had committed part of my cash reserves that I hold back only for such opportunities and that since I was committing actual cash capital they could perhaps read through the lines as it were, to determine what I felt my technical tools were telling investors.
Starting yesterday, with all the debate raging on the options forum over whether Technical Analysis works, I sent an email to each of the 377 asking what they had done and their observations.
I received replies from 348 by this evening and I tallied them up. Here is what I found.
Investor Replies
22 Bought Puts and are still holding their stock. Their puts are up more than triple and they have easily covered their losses because they could afford a lot more puts than the 200 to 500 shares of Apple Stock they owned.
29 sold their Apple stock and bought puts and again most are up triple over where they bought their puts.
190 sold all their shares and have not gone back into Apple Stock.
Of the 190 who sold, 117 sold in the past week unable to stand what they see as the continuing collapse of Apple stock.
Second Question
I asked them if they felt technical analysis failed them in any way or if they believe technical analysis could have helped or did help. I asked what their opinion of technical analysis was after what they had just gone through.
115 replied they felt technical analysis might work but they doubted they could follow it daily and so felt it probably wouldn’t be helpful.
47 replied they believed technical analysis had worked for them and wondered if I had other stocks they could consider profiting from and would I be willing to share their names.
155 replied they felt technical analysis didn’t work and they would not trust it when doing trades.
Interestingly of the 348 who replied 241 indicated that they would prefer to use technical analysis only when their trades were in trouble or the market direction was pulling back to see if it “could help”.
Out of the 348 who replied, 224 wondered if I would be willing to offer them my opinion on technical analysis of their various stocks and would I do this regularly for a small fee or for free.
Third Question
The last question I asked was did they feel that technical analysis could be used daily or was it too much work.
53 replied they thought they could use it every day and of that number 33 wondered if I could show them how to use it after trading hours because they had no time during the day.
285 replied they thought it was too much work and would rather “consult’ it or me as needed or not at all.
Technical Analysis of Apple Stock Failure Conclusion
In my opinion it is not technical analysis that fails but the ability of investors to consistently use it, learn it and become proficient at reading the signals. Most investors second guess the signals and keep waiting days after the signal has been generated instead of acting. Finally by the time they jump in, the signal is so old that the returns are poor or negative and they blame technical analysis.
Most telling was the number of investors who bailed out of their Apple Stock this week as Apple Stock fell below $550. Most investors are similar, selling when they cannot stand the stress of what they believe is a coming bigger collapse than the losses they have already taken.
Technical Analysis Trades To be Added To The Members Section
To assist where I can, I will be adding two stocks to my members section that I will update consistently with the technical analysis outlook for investors to follow along. Over the past two years I have worked with a number of investors offering mentoring tips via email as they learn the ins and outs of some strategies. To assist members of my site I will use two different strategies so members can begin to learn and see whether technical timing works for them.
I believe that investors in general have a hard time consistently applying technical analysis to their stocks, as well as following through on the decision-making process, entering and exiting trades when advised to do so by timing indicators and in general do not understand fully how to interpret what the timing indicators are advising. I hope by adding this to the mentoring tips category I can help some investors in furthering their knowledge of technical analysis for profiting from investing.
What I Am Doing With Apple Stock Now
In closing, let me advise that I have over the past two trading sessions sold all but 5 of my put options on Apple Stock. For the past two days the technical indicators that are in the charts above have indicated that Apple Stock is extremely oversold and should bounce. It may even have found a bottom for a while here. I will hold the remaining 5 puts until i see clear signals from the technical indicators that Apple Stock has indeed bottomed and downside is limited. That will be when I sell my remaining puts which I bought starting Sept 19 in Apple Stock.

