Market direction today was one of the more exciting days so far this year. Earlier today I commented how market direction was entering a pivotal day. It turns out it was indeed pivotal. The S&P 500 fell all the way to 1313.29 but ended down just 2.81%. The fall to 1313.29 wiped out two days of gains for the S&P and in a couple of hours the S&P managed to recover. It was an exciting day and while I thought the S&P would sell off into the close, it instead closed near the highs for the day.
Yesterday’s Market Timing Indicators
Today’s stock market direction action shows how interesting Technical Analysis of the Stock Market is. Yesterday the market technical analysis tools were 3 to 2 bearish and 1 was neutral. The fast stochastic was warning that there was enough strength in the market that holding spy puts overnight could be a mistake. Meanwhile through slow stochastic had been warning all week of a lower stock market direction. Add to that the MACD Histogram which has advised since Thursday of last week that the market direction was down.
All of these technical tools readings came into play today. The fast stochastic was wrong about holding spy put contracts overnight. I would have had a very nice trade in the morning. But the fast stochastic was correct that there was strength in the stock market and indeed the stock market direction turned right around and came roaring back up. But slow stochastic, ultimate oscillator and MACD were right that selling lay ahead and there was plenty of selling in the morning. So in the end, even the neutral reading from Rate Of Change in the end proved right.
Imagine the investors who sold in the morning only to watch their stocks come back up at the close. This is whipsawing that upsets a lot of investors but which I as a put selling investor enjoy as it pushed up option premiums. You can look at my YUM Stock trade from today to see what volatility can do as I sold the July $57.50 put for 1%.
Market Timing Indicators Are Now Undecided
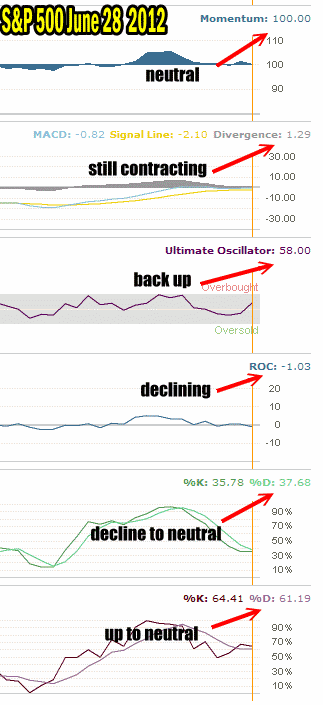
Today’s market timing indicators are undecided. Today’s market direction swings have the placed most of the market timing indicators into undecided. Momentum is exactly neutral at 100.
MACD however is still continuing to contract which as a market technical analysis sign would indicate that the market is going to be lower up ahead.
The Ultimate Oscillator has swung back up which may indicate some upside potential ahead.
Rate of change is slightly lower but closer to neutral than negative.
The Slow Stochastic is pointing down to neutral while the fast stochastic is pointing to up to neutral.
Neutral at this stage is undecided and with 4 market timing tools undecided, the stock market direction could be a toss-up for tomorrow.

Today's Market Timing Indicators are generally undecided.
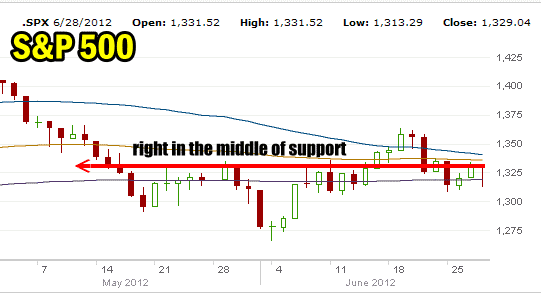
Market Direction Chart for June 28 2012
The S&P chart below of the ongoing correction shows that the stock market is staying primarily within the middle of support. Like always staying sideways can only last so long. The easier market direction is always down but presently with most market direction indicators undecided the market should hang on and possibly climb a bit from here.

The market direction chart for the recent correction shows how often the market has stayed within the support zone.
Market Direction and Market Timing Summary For June 28 2012
In summary market direction remains stuck in this middle support zone. MACD continues to erode which is a poor sign and a warning that further bad news could push the market direction lower. Some items of concern include the number of companies starting to announce poorer than expected earnings. Research In Motion Stock plunged on their shocking earnings report. Nike also announced fourth quarter earnings that were just $1.17 versus the expected $1.37 and their stock fell more than 10% after hours. In Germany unemployment has crept higher. All of these are warning signs and with the correction just down 10% from the April and May highs, there is lots of room for stock market direction to fall lower from here. I plan to continue with the cautious bull strategy which has served me well through three severe bear markets.
Meanwhile market direction after today looks to be back to sideways.
