On Friday stocks staged a strong rally following a rise in the unemployment rate to 3.7% as more employees returned to work and others were looking for work. Many analysts and investors looked at Friday’s rise in the unemployment rate as another indication the Fed’s tightening is having an effect and could delay the next interest rate hike. That was enough to get the rally underway and by the end of the day the S&P was within easy striking distance of reaching 2300.
The S&P rose 61 points for a 1.45% gain to end the day at 4282. It was the best week for the S&P since the last week of March.
The NASDAQ climbed 139 points for a 1.07% gain. For the NASDAQ it was another week of solid gains and the sixth straight up week.
Let’s review the SPX closing technical indicators on Fri Jun 2 2023 to see what to expect for stocks for Mon Jun 5 2023.
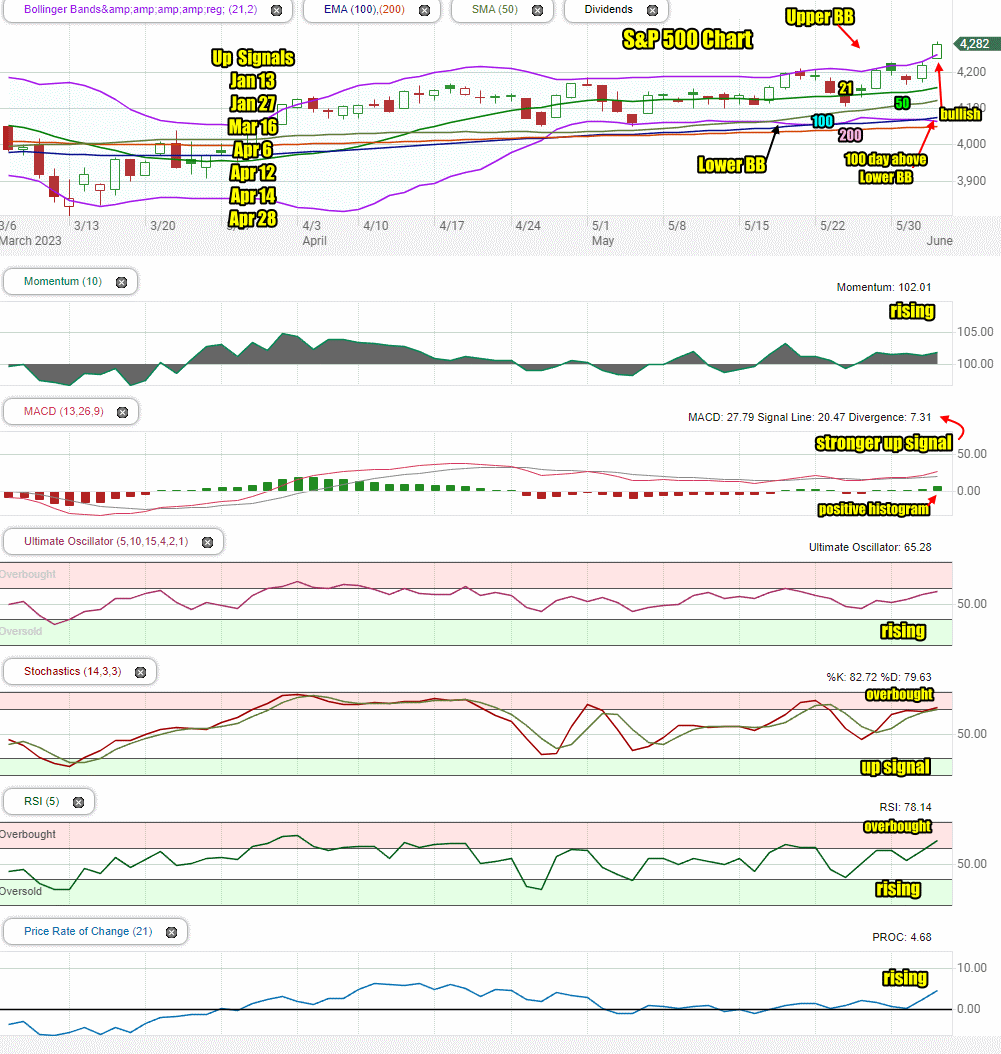
Stock Market Outlook Chart Comments At The Close on Fri Jun 2 2023
The index closed higher and left behind a bullish candlestick for Monday.
The SPX continues above the 21 day moving average and is pressuring the Upper Bollinger Band higher. This is bullish.
The 100 day moving average moved above the Lower Bollinger Band on Thursday and continued higher on Friday which is also bullish.
The 21, 50, 100 and 200 day moving averages are rising which is bullish.
The S&P chart is more bullish than bearish and is pointing to a higher day on Monday but also warning that the index is becoming overbought and dips are likely.
There are 7 up signal since January and no down signal in the chart.

Stock Market Outlook review of Fri Jun 2 2023
Stock Market Outlook: Technical Indicators Review:
Momentum: Momentum is rising and positive.
- Settings: For momentum I use a 10 period when studying market direction.
MACD Histogram: MACD (Moving Averages Convergence / Divergence) issued an up signal on Friday May 26. The up signal strengthened on Friday. The MACD histogram also gained strength.
- Settings: For MACD Histogram, I am using the Fast Points set at 13, Slow Points at 26 and Smoothing at 9.
Ultimate Oscillator: The Ultimate Oscillator is rising and positive.
- Settings: The Ultimate Oscillator settings are: Period 1 is 5, Period 2 is 10, Period 3 is 15, Factor 1 is 4, Factor 2 is 2 and Factor 3 is 1. These are not the default settings but are the settings I use with the S&P 500 chart set for 1 to 3 months.
Slow Stochastic: The Slow Stochastic has an up signal in place. It is nearing overbought readings.
- Settings: For the Slow Stochastic I use the K period of 14 and D period of 3. The Slow Stochastic tries to predict the market direction further out than just one day.
Relative Strength Index: The RSI signal is rising and positive. It is now signaling overbought.
- Settings: The relative strength index is set for a period of 5 which gives it 5 days of market movement to monitor. It is often the first indicator to show an overbought or oversold signal.
Rate of Change: The rate of change signal is rising sharply.
- Settings: Rate Of Change is set for a 21 period. This indicator looks back 21 days and compares price action from the past to the present. With the Rate Of Change, prices are rising when signals are positive. Conversely, prices are falling when signals are negative. As an advance rises the Rate Of Change signal should also rise higher, otherwise the rally is suspect. A decline should see the Rate Of Change fall into negative signals. The more negative the signals the stronger the decline.
Support and Resistance Levels To Be Aware Of:
4310 is resistance
4300 is resistance
4290 is resistance
4275 is resistance
4250 is resistance
4240 is resistance
4225 is resistance
4210 is resistance
4200 is resistance
4190 is resistance
4180 is resistance
4175 is resistance
4150 is resistance
4135 is support
4125 is support
4100 is support
Stock Market Outlook for Mon Jun 5 2023
For Monday the S&P technical indicators are pointing to a higher day although there are also warnings that dips should be expected as the index is now into some overbought readings. However with President Biden signing the debt ceiling bill, the index should be able to build a further pop. If the S&P opens a lot higher on Monday, watch for a dip by 10:00 AM before the market continues to rally back. Otherwise, if the index opens unchanged I am expecting a few dips sporadically during the morning but higher spikes as well.
Intraday the index should touch 4300 before closing below it.
Potential Economic and Political Market Moving Events
This is a fairly light week for market moving events. That should help the bulls push above 4300.
Monday:
9:45 May services PMI is expected to be unchanged at 55.1
10:00 Factory orders are expected to slip to 0.6%
10:00 ISM services are expected to be higher at 52.3%
