Put selling as an investment strategy provides protection, locks in profits and can be adjusted to accommodate changing market conditions. Today is a great example. Today saw the biggest rally of the year as the DOW rose 286.84 points, the S&P 500 29.63 and the NASDAQ 66.61 points. So is the bottom in for this correction? My market timing indicators believe it is. But through put selling I rarely worry if the market moves up or down as I can adjust all my positions depending on the mood of the stock market.
Despite the big rally though, I will wait for the market to get past the 50 day simple moving average before signalling all clear sailing ahead. Therefore I remain cautious. That doesn’t mean not investing. Far from it. This is a great opportunity. The market rises and places my naked puts further out of the money and I can close for big profits. No market goes straight up so I would expect weakness and I will be put selling against weak periods as well including weakness in stocks.
To stay in this type of market while waiting for the 50 day simple moving average signal, I have some rules that I have followed for years. These rules allow me to stay in the market, continued put selling and selling covered calls, and provides some comfort in the event the market turns south again.
My Put Selling Rules For A Recovering Market
Don’t Short Rising Market Direction
When the market direction is solidly up there is no point in shorting it through buying puts or buying spy puts for example. The best moment to buy spy puts or short is when the market direction is neutral and clearly eroding. If the market is recovering there will be hiccups but those are not the moments for me to short the market. I need clear proof the market recovery is fading.
Don’t Roll Covered Calls Up On Big Up Days
When the market direction jumps as solidly as it has this morning I never roll covered calls back up that I may have rolled down earlier in the correction. Normally a huge up day will push call option premiums too high for the buy back unless the goal is to roll lower with the covered calls or roll out to the same strike. Then rolling covered calls makes sense. But to take a loss on covered calls in big up days can often be avoided by waiting a day or two after the market direction push up as it is often followed by some back testing which will lower call options premiums as volatility continues to fall after the big one day rally.
Close Puts That Are At The Money And Fall Out Of The Money On Rises
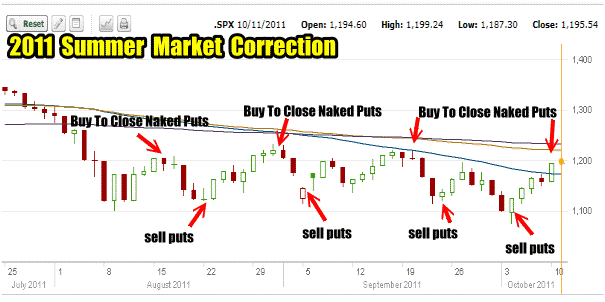
I watch my naked puts that I sold near or at the money. If the underlying stock moves back up and places my puts out of the money I watch the market timing technical indicators for any sign of a resumption of the downtrend and buy to close profitable naked puts that are at risk of assignment. If the market continues higher and June options expiry are just a few days ahead, I rarely worry about closing early. I wait until they are worth just a few cents and then I buy to close. The chart below for 2011 shows how to buy to close naked puts at the top of rallies.
Limit Put Selling To The Down Days
I limit my put selling to down days only when the market starts to recover. As you can see in the market timing charts from 2011 below, the market never moves straight up or down. In a market rally back from a solid correction I limit put selling only to down days. Premiums are better on down days and investors after a big correction remain spooked so any move back down will push put premiums up quickly. Put selling on up days in a market recovery results in small put premiums.

Put Selling Opportunities Abounded in the Correction of 2011
Limit Put Selling To Strikes To The Previous Lows
After a market correction and rally back, it is tough to know if the rally is going to hold. I have always done well by remembering that most pushes back down will result in a higher low. While there is no guarantee in investing, I have found that a 10% correction in a bull market and then a rally back, even if it is just 5% often means the next pull back or push back down will set up a new higher low.
I therefore look at my stocks that I want to put sell against and I see what strikes are either at or just slight below the most recent lows which they set in the last market pullback.
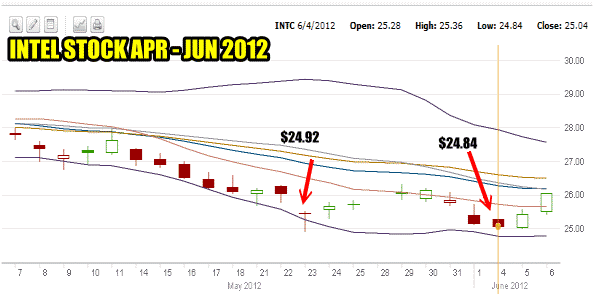
For example, look at Intel Stock below. This great company fell with the market despite all the analysts talking up a storm about Intel Stock. In the latest market correction Intel Stock fell to a low of $24.84. On May 23 it set a low of $24.92 and on June 4 another low of $24.84. I therefore would be put selling against the $25 put strike on any weakness in the stock or the market. In other words when the market is not rallying and pulls back again, the $25 strike will be my put strike to continually sell.

Put Selling Strikes in Intel Stock can be learned from the previous spike down.
Limit Put Selling To Smaller Contract Sizes and Scale Into Positions
There is no guarantee in investing. A market rally can turn out to be a trap in a matter of a day or less. When I go back to put selling I take my time with positions. The Intel Stock example above would see me selling 5 naked puts at the $25 strike on weakness. Then with more weakness I would sell another 5 naked puts. Finally further weakness would see me sell another 5 naked puts at $25. By doing this I am protecting myself protection against a return of the correction that might push beyond 10%.
Scale In Put Selling Based On The Moving Averages
As the market recovers watch the moving averages to scale into put selling on weakness. At the 200 moving average on weakness I would sell the perhaps 5 naked puts on a company whereas I would rather have sold 15. If the market recovers to the 100 day moving average I would be put selling larger numbers of contracts, probably at least 10. At the 50 day moving average I would be back put selling almost all the contract sizes I wanted. All of these put selling contracts would only be done on weakness in the stock or the stock market.
Scale Into Covered Calls
Use the same formula for scaling into covered calls. Go ahead and buy some stocks but sell deeper into the money at the start, picking just below where the stock ended up on Friday or Monday when the market hit a bottom. Then reduce the depth of the in the money covered calls as the market recovers. Finally by the 50 day moving average sell out of the money again. For example:
ABC Stock on Monday hit a low of $25.60.
Today ABC STOCK has moved to $27.00.
I would love to buy 1000 shares but instead I buy 300 shares and I sell the July $25.00 covered call. The $25 is just below the latest low for the stock in the correction.
At the 100 day moving average ABC Stock may be up to $28.50 so I buy 400 shares and I sell the July or August $27.00 covered call. I am still in the money with covered calls but not as deep.
At the 50 day moving average ABC Stock is up to $29.55 and I but my final 200 shares and I sell the August $30 or $31 covered calls. If this is a stock I would love for a few months it is easy once the recovery commences to slowly roll covered calls higher and further out in time. For example I would roll up the July $25 to Oct $26 or depending on the premium, $27, but only if there was a credit or a very small debit.
Using this strategy has save me many times when I thought the market had bottomed but instead it was just a rally.
Don’t Fret If Market Direction Continues Higher
Don’t be concerned if market direction continues to push higher. There are opportunities constantly. This morning’s action is good for the market. It helps to build a base of support which is what the market needs. But remember that this move today still leaves almost 8% of lost ground to be recovered. At the time of writing this article the S&P is at 1315. The May 2 high of 1422 is still 107 points away or 8%. There will be lots of opportunity for profit-making ahead.
Wait For The All Clear Before Going Back To Margin
Back in April when the stock market looked a little soft I commented in my articles that margin use should be reduced. By the time the 100 day moving average is broken, I am using no margin at all. Stocks have to fall more than 30% for me to consider using margin in a correction.
When the market rallies back like it did today, many investors will want to get back into the action as fast and as fully as possible. Instead consider building margin use slowly back up as the moving averages are solidly held. For example:
20% margin at the 200 day moving average recovery
30% margin at the 100 day moving average recovery
50% margin at the 50 day moving average recovery
This scaling back into margin use has worked well for me for many years.
The purpose of margin for me is to generate additional profits but with little risk of needing the margin. I therefore like to keep my margin available for those trades that have very little chance of assignment. I really don’t want to be paying interest on my margin. Instead I like to use margin for trades that are so far out of the money that there is little chance of assignment. That means an uptrending market and until the 50 day is recovered I have a lot of doubt in market rallies after corrections of more than 8% and this recent correction was just below 10%.
Put Selling Tips Summary
All of the above tips I have used after market corrections begin a recovery. In 2011 many analysts thought the stock markets were recovering in August when the rally began. Instead I saw a roller coast ride that made me a lot of profit and left me holding no stocks by the end. Put selling can be a great strategy as can covered calls if an investor takes the time to learn some strategies that can be applied to allow him to continue to invest in a market recovery while protecting himself from a possible back slide in stocks.

