Market Direction is obviously the most important aspect of profiting from the market trend and protecting a portfolio from the ravages of corrections. Having a good understanding of market direction can be assisted through applying and understanding market timing technical tools. This is the reason I have written various articles dealing with the different market timing tools such as my Rate of Change article. The beautiful thing about a correction is the opportunity to purchase stocks at lower prices for the next run-up. The problem about a correction is knowing when to buy those stocks at their lower prices without ending up buying as the market direction moves lower.
Market Direction and Instinct
Instinct plays a large role without doubt. When all the markets ran up in late March and early April and analysts suddenly got excited about the markets instincts should have told investors a few things. One was that many stocks like Coca Cola Stock, Amazon Stock, Microsoft Stock, Intel Stock and many others were ahead of themselves. Two was the disproportionate number of dividend stocks that were being bought up and pushed higher while treasury yields continue to fall. Three had to be the non-confirmation of the recent new highs. The market should have pushed beyond those new highs, pulled back, tested the new highs and moved higher. This did not happen in any of the markets which is a clear market timing signal that a temporary market top has been put into place.
To Get The Bull Back
To break that recent market top the markets must pull back, find support and then in strength push beyond their most recent highs, with strength. Until that happens the market will stay sideways to down. The longer a market trends sideways the chance of it falling further grows.
Market Timing Among All The Markets
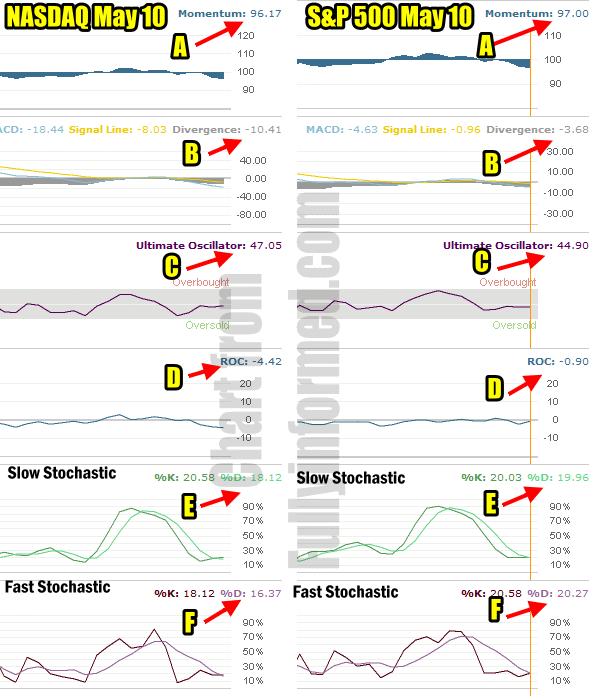
Sometimes market direction can be spotted by using the same market timing tools across the different market exchanges. For example, below is the NASDAQ market timing tools for today compared to the S&P500 market timing tools.

Market Timing Indicators From Both The NASDAQ Index and S&P500 Index can be comapred for overall market direction.
Market Timing Tools Compared
A) This is momentum and for both the NASDAQ Index and the S&P500 momentum is falling signalling more selling ahead. In other words strength in these two markets is falling as momentum falls.
B) MACD Histogram (Moving Average Convergence / Divergence) is among the top market timing tools for its accuracy in timing the market for both declines and uptrends. The market direction is being signalled as lower still in both the NASDAQ and the S&P 500. Despite today’s rally the MACD Histogram is even lower than yesterday and in the NASDAQ it is showing that the pressure is building for a move lower.
C) Ultimate Oscillator, my favorite market timing tool failed to turn positive despite climbing back over the past two days and now is signalling that both the NASDAQ Index and the S&P500 Index will move lower.
D) Rate Of Change is negative on both the NASDAQ Index and the S&P 500 Index which points to more selling ahead.
E) The Slow Stochastic For both the NASDAQ Index and the S&P500 is one of the few bright spots. Yesterday is signalled that the selling has been overdone and today it continues to indicate that the market should bounce from here.
F) However the Fast Stochastic for the NASDAQ Index is flashing a possible bounce but with the S&P 500 the reading is complete flat which from historic perspective means more selling is still ahead.
Market Direction Based On The Average
Taking the average of the above 5 market timing tools the overwhelming odds are for both of these markets to push lower over the upcoming trading days.
The Importance Of 1350 On The S&P 500
While many investors don’t believe in technical analysis and “jargon”, the break of the 1350 on the S&P 500 on Tuesday and Wednesday of this week is I believe signalling that the market cannot hold here. The 1350 marks a 5% correction which is normal in a bull market. However a 10% correction is also normal and it builds more support.
The question now will be whether or not my fundamental market timing indicators which in Tuesday’s market timing column showed market direction as a bounce up, is all that happened today and from here the market direction will move back lower.
The break of 1350 could create a new resistance level for the S&P. If on Friday the S&P can hold above the 1350 level convincingly then the market selling may slow considerably. The NASDAQ is down over 7% and the Dow has lost the least amount from its intraday high of 13338.66 set on May 1 to its recent low of 12748.48 for a loss of 590.18 points or 4.4%. I believe Friday could be a pivotal day.
Today’s Market Action Was Poor
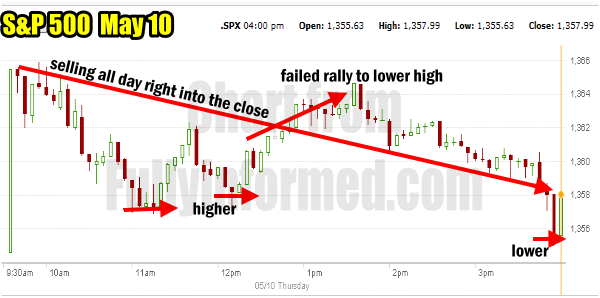
Despite the market eking out a small gain on the S&P and Dow, the market action today was terrible.The gap up was sold off throughout the day and only in the last few minutes did the market manage to turn to a positive close. The first pullback was met by a higher lower and then a failed rally to what ended up being a lower high than the opening gap. From there it was selling into the close with a half hearted push in the last few minutes. A chart like below is a clear indication of more selling ahead. There is no conviction among investors. This is a traders market.

Market action on May 10 was terrible with many signs of further selling ahead.
Market Timing Indicates Market Direction Is Still Lower
For the time being, the market remains a traders’ market as all market timing tools indicate more selling ahead and the market direction will continue lower. The question now will be how low can the stock market fall before investors get excited about stocks again. A 10% correction should bring investors back to the market but often after 10% many step back waiting for signs that others are risking their capital. Therefore sometimes 10% can end up being 15% before investors return to purchase stocks.
