In Part 1 of the study of Support and Resistance I looked at the value of using support and resistance and why it is easier to apply it to stocks within specific industry groups. I gave a short look at using support and resistance to sell puts and write covered calls against Johnson and Johnson stock.
In Part 2 I will look at how I combine the Volume technical indicator to my charting tools to confirm support and resistance levels in the underlying security. In Part 2 I will be using PepsiCo Stock for my example.
One thing that studying support and resistance shows is that even the less volatile stocks such as Johnson and Johnson Stock or PepsiCo Stock can still provide good returns for option sellers if they apply support and resistance levels to their investing in order to decide prime moments to sell puts and covered calls for good option premiums.
I only sell puts on stocks I would own. Because of that I can sell puts at support as the stock is falling toward support. This means I earn good premiums on my puts and if I am wrong, I am willing to accept shares and sell covered calls until exercised out of the stock.
This is a distinct advantage over the put seller who likes to sell puts for premium, but NEVER wants to own the underlying share. To reduce his risk of assignment he sells below support. That means this investor must sell further out of the money which will mean smaller put premiums even by selling as the stock tumbles toward support. As investors know there is no free-lunch or holy grail in investing. If the investor wants less risk and sells far out of the money than the risk of assignment is reflected by the smaller premiums earned. In selling puts it is pretty simple. More risk taken by the investor equals more premium earned.
I have often found that by selling puts at support levels I reap good returns and have a reasonable chance the stock will bounce away from support and leave me without any shares assigned and a nice put premium earned.
In a market or a stock with higher volatility, it is naturally easier to sell puts out of the money for decent returns simply because volatility drives up option premiums.
Support And Resistance Is Not Hard To Spot
Volume is probably the best technical tool to use to assist in establishing support and resistance levels in any security. Volume is an easy indicator to use once an investor understands what it is and how to apply it.
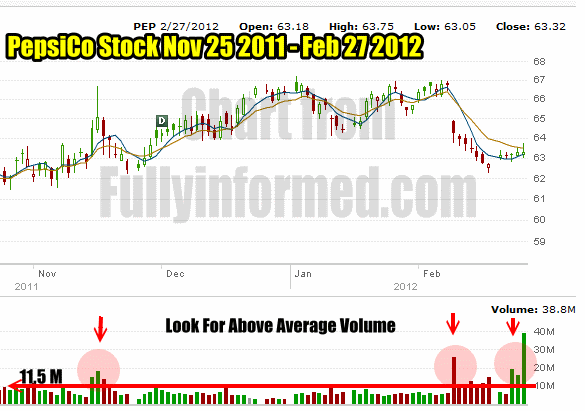
In my example below I am looking at PepsiCo Stock. On Friday Feb 24 2012 when the stock market closed, PepsiCo stock traded 16.1 million shares. Most discount brokers show volume. On the far right of the below image the first number is TODAY’S VOLUME (GREEN) and the second the AVERAGE DAILY VOLUME (BLUE), which for PepsiCo stock is 11.5 million. These are the two most important numbers for assisting in looking for support and resistance.

PepsiCo Stock showing average daily volume of share traded assists greatly in establish support and resistance levels of a stock.
Here is how I use volume to assist in spotting support and resistance in every stock I trade.
I take the average daily volume of 11.5 million shares and lay it out on a chart of PepsiCo Stock. To do this I drawing a line at 11.5 million shares across the past few months of trading in the volume indicator. You can see this in the PepsiCo Stock chart below. This is my first step towards finding support and resistance in a stock.

Support and Resistance charting starts with the volume technical indicator.
By drawing the average daily volume of 11.5 million shares on the chart, I can readily spot where the above average volume days are and how it relates to the movement in the stock. This is the second step to determining where support and resistance is in a stock.
I have highlighted in red the three main areas since November 2011 that need further review. In this article I will be discussing the two highlighted areas on the far right .
Support and Resistance Indicators In PepsiCo Chart
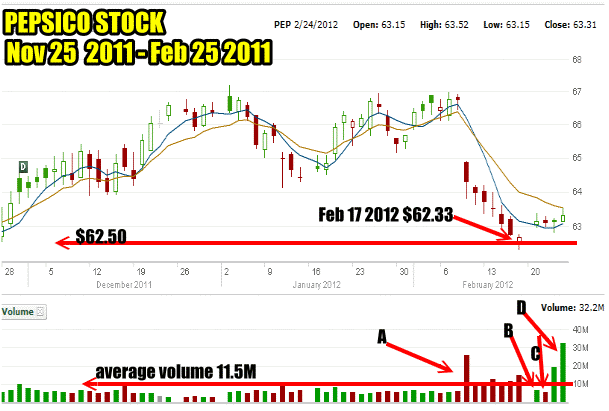
A) Starting on Feb 9 2012 the stock volume increased as sellers dumped PepsiCo Stock. The first day was the heaviest because the news of PepsiCo Inc lay offs and restructuring some departments worried investors and investors fear everything. They therefore sold shares. The stock fell heavily on that day and I sold my first set of puts. This is marked A in the chart below.
The next few trading sessions the stock continued its decline but volume pulled back. Smart money traders would be watching the stock at this point. They may even nibble at a few shares daily but they are watching to see if PepsiCo can fall further. They know that $62.50 holds support because they follow support and resistance on every stock they are interested in trading.
Investors and traders who following support and resistance as a technical timing tool will have watched PepsiCo Stock for months to years. This is because support and resistance changes depending on many factors over the months and years and investors will want to know about those changes to support and resistance to pick entry and exit points.
FEB 17 : On Feb 17 2012 PepsiCo Stock fell through support at $62.50 but closed at $62.68 above support. Volume was 14.6 million shares. The move to the support line would be watched carefully by traders. The bounce back to support after falling through it, is a good sign.
B) The next trading session on Feb 21 the stock moved back up and closed at $63.14 on light buying volume. The green bar in the volume chart indicated that buying was stronger than selling. In other words there were plenty of buyers for PepsiCo Stock so every seller had no trouble selling their shares and PepsiCo Stock did not fall lower than the previous session, Feb 17.
C) Sellers now entered the next day and those who are in for the bounce, sold shares but the stock held above the $62.50 support and closed at $63.10
D) The next two trading sessions buyers have moved back in. As far as they are concerned PepsiCo Stock has held the $62.50 support level and they believe the stock is going to move higher. Volume increased both days as smart money traders are moving back into PepsiCo Stock as they believe it will move higher.
When considering the chart above you can begin to see how following volume and watching the movement of the stock is actually pretty straight forward.
Here Are The Steps For Finding Support
1) Find average trading volume.
2) Plot it on a chart.
3) Look for above average volume.
4) Examine the stock to see any correlations between the above average volume and the decline and rise in the stock.
5) Watch the bounce to see at what valuation the stock bounced.
6) Apply this to previous months and quarters to see if there is any similarity.
7) Pick the support points for the stock based on those bounces.
Does It Always Work?
Yes and of course no. Nothing in investing just like life, is perfect. But this strategy does not need to be perfect because that is not what investors are looking for.
Investors Are Seeking Common Occurrences
Instead, investors are looking for common occurrences when comparing the bounces. This gives a pretty good indication of support in a stock.
To figure this out requires investors to pick stocks that interest them and then to follow them. Sometimes investors follow those stocks for many years other times for just a few quarters.
Let’s look back a bit further on PepsiCo stock to see why investors and traders picked $62.50 for support level in PepsiCo Stock in February 2012.
Support and Resistance In The Fall Of 2011
The farther out an investor looks at a chart the easier it becomes to spot the support and resistance levels in a stock.
In the late summer and into the fall of 2011 the market entered a new bear market and while many investors worried that the stock market would fall a lot further, the smart money traders know that investors dwell on fear. For one thing they listen too much to the talking heads on television. Instead the smart money traders know that a 20% decline will make money through bounces in a stock and increased volatility which goes hand in hand with a big decline in stock markets.
PepsiCo Stock Chart Fall 2011
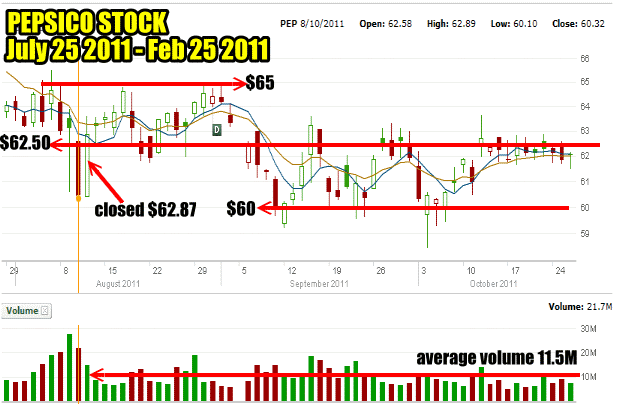
Looking at PepsiCo Stock it has traded above $62.50 until August 9 when it fell on large volume of 27.3 million shares to a low of $60.61 and then closed at $63.09. What is important about August 9 is that the stock closed above $62.50 support.
The following day, August 10 2011, I have marked in the chart below. The stock fell on slightly less volume of 21.7 million shares. That day the stock closed at $60.32, the low for the day. If PepsiCo Stock was going to fall further it should have done so on the next trading day.
Instead on the next day Aug 11 2011, on just 14.7 million shares the stock closed again above support at $62.87. Looking at the chart for the fall period you can see how often the stock closed or traded at $62.50. It is obvious to traders that PepsiCo Stock has support at the $62.50 level.
Resistance Level Is Obvious In PepsiCo Stock
There is obvious resistance at $65 since prior to the selling in August PepsiCo stock was unable to break through the $65 price level and establish a new higher trend. This then becomes resistance or where there are few buyers for the stock. I will take a more detailed look at resistance in further articles.
On the heaviest days of August the stock fell to $60 and then moved back to $62.50. Traders will have marked $60 for the bottom range of support and know that $62.50 is true support in the stock.
Why I Sold Puts On PepsiCo Stock In February 2012
Now you know why I sold the $62.50 puts this February. I have followed PepsiCo Stock for many years and the above charting of support and resistance is why in February 2012 when the stock fell I posted to the options forum that I was selling puts on PepsiCo Stock and indicated I believed support was at $62.50 in the stock.
For interested readers this support and resistance link will take you to PepsiCo Inc Investor Relations.
Support And Resistance Summary of Part 2
This is only a very small part of understanding support and resistance. In further articles I will expand on applying support and resistance to trades for interested readers. It is important for investors to understand that nothing is written in stone. There is no secret to investing that works all the time. Support and resistance works but not always. There are unforeseen events that will impact support and resistance points in any asset.
Investors need to set aside fear and realize that market crashes such as 2008 to 2009 and 2000 to 2003 are not common. The 2008 to 2009 market crash may never have happened if the government had faced up to the realities of the housing crisis and what turned into the credit crisis. The next crisis may very well end up being derivative related.
Whatever the cause of the next crisis, investors have to think like a trader and stop being spooked at every turn. If a market is going to crash it will not do it overnight. This is why the one day market crash of May 2010 and October 1987, were quickly bought by traders. A true bear market collapse happens over a period of time allowing investors plenty of opportunity to get out and back in.
By listening to the media and their endless parade of supposed market gurus at every market pullback, investors are shaken out of their positions and as we have just seen in the charts above, the smart money traders are the ones who benefit from this fear. If investors would learn to watch stock charts and not buy at elevated levels but instead take the opportunity to put sell against stocks at low levels, they would not be as fearful of market pullbacks.
But the overall tendency of the majority of investors is to buy at market and stock tops and I doubt this will change. I hope through the articles on my site to show investors what I learned 4 decades ago. There is no reason to fear the bear but instead embrace it for the fabulous returns it brings both on the way down and the way back up.
I hope that through articles such as this one, investors will take time to look at the charts of their favorite stocks to learn how to spot support and resistance levels so they can improve their returns.
Through using support and resistance charting investors can end the cycle of always buying at the top and selling at the bottom.
Another distinct advantage of put selling against stocks I would own, is the level of confidence I have in my support and resistance charts. My confidence of support and resistance in PepsiCo Stock for example allowed me to sell puts from .74 cents to $1.06 for large gains at the $62.50 strike since I have confidence that the stock would bounce from that support level.
If it does not and I am assigned shares, I know that the next level of support at $60.00 would have given me the opportunity to sell covered calls and work my position to the point of being exercised for a profit.
All of this is possible because of having a plan in place at the outset and knowing how to chart support and resistance levels in the underlying security. It’s not rocket science and any investor should be able to use support and resistance to assist in their investing.
Read Support and Resistance For Put Selling And Covered Calls Part 1


