On Fri Jun 1 2018 investors read the latest non-farm payroll numbers for May 2018.
The economy roared ahead in May 2018 generating 223,000 new jobs and dropping the unemployment rate to 3.8%. This is an 18 year low. It also sets the economy up for an almost guaranteed rate hike from the Federal Reserve in June. Gains were seen in all industries but in particular retail, health care and construction saw strong increases in May.
White House economic advisor Larry Kudlow spoke on CNBC indicating “Business is coming alive. This could go on for a whole bunch more years, in my judgement.”
Since President Trump’s election 3.4 million jobs have been created according to the Department of Labor. More than a million jobs have been created since the tax cuts bill was signed. The one key area that is starting to show some improvement is wage gains. However economists believe that the tighter labor market will see increases in wage gains shortly.
With the unemployment rate at 3.8% and strong jobs numbers for May the chance that this will go on for years is anyone’s guess. Mine is that it won’t last for years. Employment trends have always had cycles. These cycles culminate as employment continues to grow. Eventually when the number of employed reaches historic levels such as we are seeing now, there are usually several months before an economic cycle begins to change and unemployment slowly creeps higher.
Unemployment and S&P- 2000 to 2003
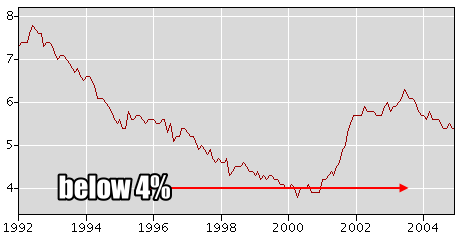
Looking at the unemployment rate at the start of 2000, you can see in the chart below from the Bureau of Statistics that the unemployment rate fell below 4% as the S&P 500 peaked and then began rise while at the same time the S&P 500 began its decline which lasted into the start of 2003.

Unemployment rate 1992 to 2004
Unemployment and S&P- 2007 to 2009
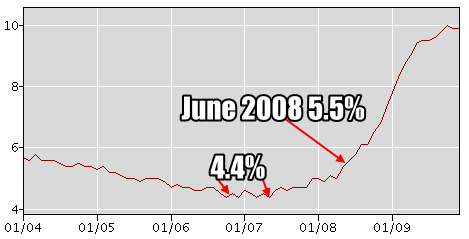
The “Great Recession” also sees its roots in the unemployment rate as the rate fell to 4.4% (on average) through much of 2007 just as the S&P peaked by July and then began a decline. By April 2008 the S&P was already down 250 points from its high while the unemployment rate was increasing. By June 2008 the unemployment rate was at 5.5% and the S&P was down 360 points. All of this was well before the collapse in the fall of 2008 while unemployment continued to rise.

Unemployment 2004 to 2009
Is Expansion Ending Sooner Rather Than Later
Often then, periods of very low or historic low unemployment can be warnings that the expansion in the economy is moving into its final stages of growth rather than the start of new growth. It therefore remains to be seen if the unemployment rate can continue to fall over the next year or is actually telling us we are nearing a peak which could stretch for many more months before starting to rise again.
There is also the knowledge that the economy is now into a 10th year of recovery. While it is great to contemplate that the economic expansion cycle can continue for years more, these was also the thinking at the end of the 1990’s and again in December 1969.
At the end of the 1990’s as seen in the first chart above and again in December 1969 with the unemployment rate at historic lows, the stock indexes were actually peaking as the low unemployment rate was actually marking the end of an economic boom and not the start of further growth. Could this be happening again? While we won’t know for several months, possibly even into the fall, there will be warning signs such as was seen in 2000 and in 1970.
Market Timing System Says Stay Invested But Be Cautious
As members and regular readers of FullyInformed.com know, I use the unemployment reports and the Weekly Initial Unemployment Insurance Claims as market timing systems. I started investing just before the worst bear market of the 1970’s (unfortunately). I have used the unemployment reports since that time and found them to be quite accurate at predicting when economic cycles are changing, both for contractions and for expansions.
The market timing system built around the unemployment reports is presently advising that I should be prepared for more volatility as the unemployment rate declines further which indicates a tightening of the labor market. Rates as low as 3.8% in the labor market are normally followed by more volatility in stocks as interest rates rise and the chance of further inflation grows.
This means more protection when investing is not a “bad thing” to consider depending on what products or equities are being invested in. I tend to invest primarily in large cap dividend stocks. A decline in those types of stocks is usually welcomed for longer-term investing purposes.
The May unemployment numbers continue also to advise that I should remain invested but be more cautious with any overuse of margin (borrowed capital) and stay as protected as possible. So far in 2018 the returns for my portfolios have been stellar and if the markets continue to move sideways with gyrations both up and down my portfolio returns could be better than those seen in 2015, 2016 and 2017 as higher volatility increases the profits made in my type of investing.
The April unemployment report warned that the Federal Reserve would increase interest rates in June. Investors can review the April Unemployment report through this link. The May unemployment report confirms that an interest rate hike will occur which will increase stock market volatility and see the dollar climb.
Market Timing Articles
Here is a list of articles that can assist investors in setting up their own market timing systems or methods for profit and income.
Signals To Stay Invested – Reading The Weekly Initial Unemployment Insurance Claims From Oct 5 2017
Oct 5 2017: A review of the Weekly Initial Unemployment Insurance Claims and how it reflects on the market timing system that uses the unemployment reports to determine when to enter and exit the stock markets.
Understanding Risk With The Weekly Initial Unemployment Insurance Claims Signals
May 12 2016 – Every Thursday the Labor Department issues the Weekly Initial Unemployment Insurance Claims. After almost a year of declining numbers, today’s report shows the third weekly increase in claims. With weekly claims nearing 300,000 here is what this market timing system advised investors to consider.
Profiting From Using The Weekly Initial Unemployment Insurance Claims Signals
Feb 27, 2014 – The Weekly Initial Unemployment Insurance Claims are perhaps one of the best market timing systems I have available. Here is the method I use based on the signals received from the Weekly Initial Unemployment Insurance Claims every Thursday which helps guide which strategies should be used and when.
Knowing When To Commit Capital and When To Stay Out
Jul 07, 2013 – Investors continually find their portfolios damaged and experience large losses by entering the stock market at the wrong time. Market timing is not the easiest thing to do but this strategy is one I have used since the early 1970’s to advise me when to get my capital back into the stock market and when I should stay out of the market or take my profits.
Market Timing and Understanding Short-Term Signals
Jun 13, 2012 – There are three levels of market timing, longer-term, long-term, mid-term and short-term. Every night I put up my short-term outlook which I follow consistently in order to profit from the market direction. In this article I discuss how I use market timing indicators to keep me on the right side of the market and how I combine all the various market-timing levels in order to stay profitable and stay invested even during the worst market conditions.
Market Timing What Is It and How To Use It
Nov 05, 2011 – Even for the skeptics this article is worth reading as it lays out what is meant by the term Market Timing and how every investor should consider using it in their day-to-day investing and trading. This is a great place to start for gaining an understanding of market timing in general.
Market Timing Systems
Here are a few other articles on market timing systems
Market Timing and Understanding MACD Histogram
Apr 12, 2012 – MACD (Moving Average Convergence / Divergence) Histogram is another market timing system used by thousands of investors. In this article I look at how good a technical tool it is for timing when to get in and get out of the stock market.
Market Timing System Using Weekly Initial Unemployment Insurance Claims
Jul 07, 2012 – Probably one of the best market timing system methods I have encountered to date. Nothing is foolproof but this system has kept me in and out of the trouble for years. It is excellent at advising when to stay long in the market and keep committing capital to more positions including naked puts and when to turn my capital towards bear ETFs and Ultra Short ETFs. Excellent is just about every way I can think of I follow this system every Thursday when the Weekly Initial Unemployment Insurance Claims reports are released.
Market Timing System Using the VIX Index To Trade Market Direction
Dec 30, 2012 – Another great system which I have found incredibly profitable is trading the VIX Index call options against the market direction. This market timing system has many benefits including profiting from market gyrations.
Market Timing System Update on the Weekly Initial Unemployment Insurance Claims
Mar 20, 2014 – The Weekly Initial Unemployment Insurance Claims remains one of the better market timing systems. It has a long track record of proven performance. With the market direction stuck near all-time highs many investors must wonder if this market timing system can continue to provide the guidance to stay invested safely.
