FullyInformed.com

Stock Market Outlook for Fri Mar 23 2018 – Bounce Attempt Unlikely – Lower

Mar 22, 2018 | Stock Market Outlook

Stock Market Outlook Down

Review of Thu Mar 22 2018

Summary:

Thursday saw investor concerns turn into action as stocks were dumped by investors worried about the possibility of a global trade war against the backdrop of rising interest rates.

It was a day of carnage with no bright spots although utilities and real estate sectors did hold up under the intense selling pressure.


Closing Statistics:

The closing price for S&P 500 was $2643.69. The security opened down, and fell 2.52%.

The closing price for Dow Jones Industrial Average was $23957.89. The security opened down, and fell 2.93%.

The closing price for NASDAQ Composite was $7166.68. The security opened down, and fell 2.43%.


Stock Market Outlook Chart Comments At The Close:

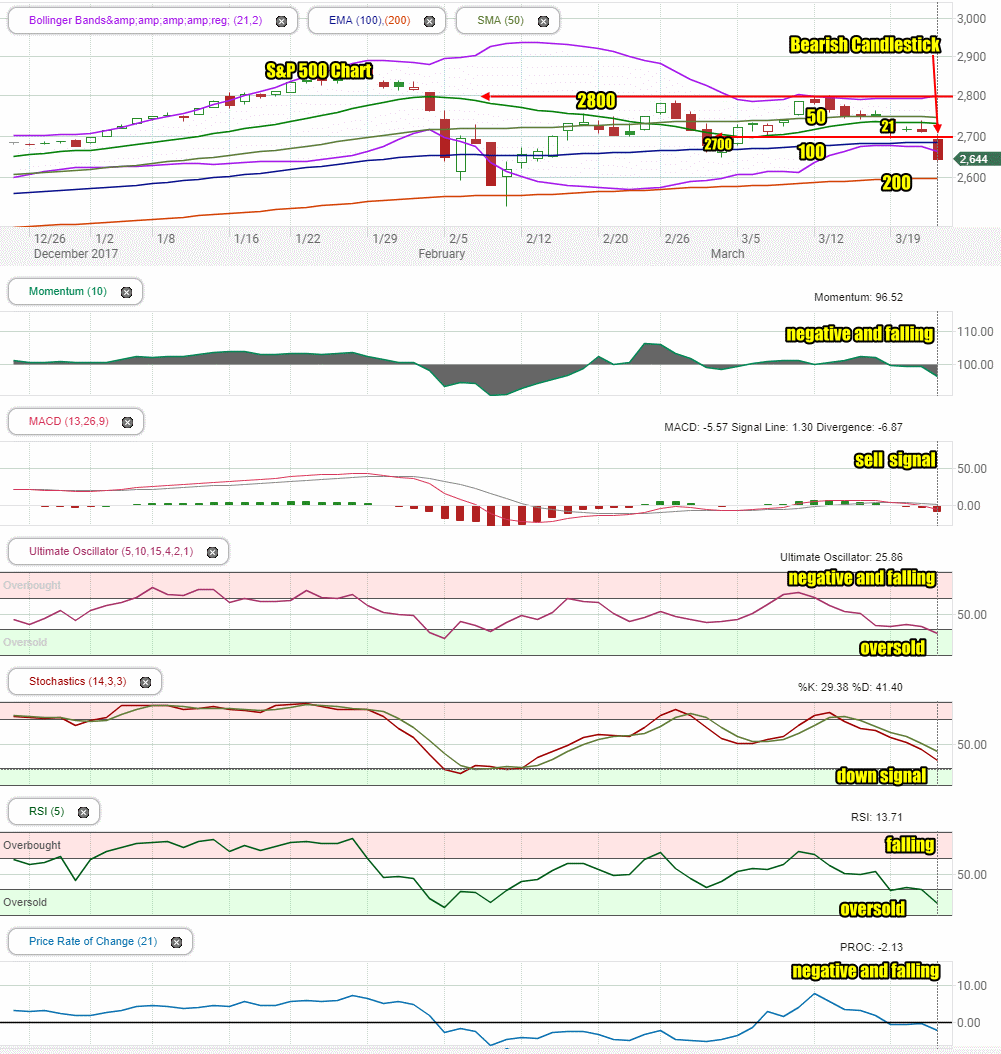
The S&P closed below the 100, 50 and 21 day moving averages again on Thursday and below the 2650 level.

The action on Thursday left behind a bearish candlestick for Friday and the possibility of a drop to 2600.

The 50 day moving average is falling and the 100 day moving averages is trending sideways. Both of these signals are bearish.

The 21 day moving average is turning back down signaling more downside action is expected.

The Lower Bollinger Band is falling away from the 100 day moving average which is bearish.

The Bollinger Bands Squeeze is still in play and looks like it will send the index lower. The chart is overly bearish.

The 200 day moving average is still climbing which is bullish.
Stock Market Outlook

Stock Market Outlook: Technical Indicators Review:

Momentum: For momentum I use a 10 period when studying market direction. Momentum is negative and falling.

MACD Histogram: For MACD Histogram, I am using the Fast Points set at 13, Slow Points at 26 and Smoothing at 9. MACD (Moving Averages Convergence / Divergence) issued a sell signal on March 20. That sell signal was stronger again on Thursday.

Ultimate Oscillator: The Ultimate Oscillator settings are: Period 1 is 5, Period 2 is 10, Period 3 is 15, Factor 1 is 4, Factor 2 is 2 and Factor 3 is 1. These are not the default settings but are the settings I use with the S&P 500 chart set for 1 to 3 months. The Ultimate Oscillator signal is negative and falling. It is slightly oversold.

Slow Stochastic: For the Slow Stochastic I use the K period of 14 and D period of 3. The Slow Stochastic tries to predict the market direction further out than just one day. The Slow Stochastic has a down signal in place for the 7th day.

Relative Strength Index: The relative strength index is set for a period of 5 which gives it 5 days of market movement to monitor.  It is often the first indicator to show an overbought or oversold signal.  The RSI signal is fallin and is now oversold.

Rate of Change: Rate Of Change is set for a 21 period. This indicator looks back 21 days and compares price action from the past to the present. With the Rate Of Change prices are rising when signals are positive. Conversely, prices are falling when signals are negative. As an advance rises the Rate Of Change signal should also rise higher, otherwise the rally is suspect. A decline should see the Rate Of Change fall into negative signals. The more negative the signals the stronger the decline. The rate of change is negative and falling indicating lower prices lie ahead.


Support Levels To Be Aware Of:

2745 to 2750 was light support

2710 was light support.

2700 was good support.

2675 is light support.

2650 is light support and 2620 is also light support.

There is good support at the 2550 level from where the market bounced back from the recent correction.

The S&P has light support at 2480. It also has light support at 2450 and good support at 2425. Below that there is some support at 2400, 2380, 2350. 2300 has the most support at present but would represent a full correction as a drop to this level would be 20% and just 5% away from a potential bear market signal.


 Stock Market Outlook for Tomorrow – Fri Mar 23 2018

The carnage of stocks on Thursday has set the market up for a move still lower. We could see a slight bounce on Friday near the open but it will be sold into. The index is set to move still lower. A move on Friday down to 2600 would not be surprising.

The action on Thursday wiped out the recent gains. The index looks like it may try to retest the 2600 level and from there the 2550 level.

Technical indicators show the market as slightly oversold but with room to still fall.

Friday will see the indexes under more selling pressure and closing lower. Higher volatility should be evident throughout the day.


 Market Direction Internal Links

Profiting From Understanding Market Direction (Articles Index)

How I Use Market Timing

How I Use Market Timing

Understanding Short-Term Signals

Various Market Timing Systems

Market Direction Portfolio Trades (Members)

Market Direction External Links

Market Direction

IWM ETF Russell 2000 Fund Info

Market Direction SPY ETF 500 Fund Info


Search

Select to view all results...

Generic selectors
Exact matches only
Search in title
Search in content
Post Type Selectors

Recent Outlooks

Stock Market Outlook for Wed Jan 22 2025 – MACD Up Signal Confirmed

Prior Trading Day Summary: Tuesday’s rally was stronger than expected with the SPX rallying 52 points ending the day above 6000 at 6049. Volume rose 400 million shares to 4.8 billion with 74% of volume advancing and 79% of all …

Morning Investing Strategy Notes for Tue Jan 21 2025

For FullyInformed Members the morning Investing Strategy Notes for Tue Jan 21 2025 review the outlook for the third week of January. Stocks discussed include JP Morgan Chase Stock (JPM), Goldman Sachs Stock (GS), Apple Stock (AAPL),  Netflix Stock (NFLX), …

Stock Market Outlook for Tue Jan 21 2025 – Unconfirmed MACD Up Signal

Prior Trading Day Summary: Friday’s rally was ended with the second best rally of the week. The SPX rallied 59 points to end the week at 5996 but intraday it moved back 6000. Volume was higher than usual for the …

Morning Investing Strategy Notes for Fri Jan 17 2025

For FullyInformed Members the morning Investing Strategy Notes for Fri Jan 17 2025 review the choppy trading on Thursday and outlook for Friday. Stocks discussed include UnitedHealth Group Stock (UNH), 3M Company Stock (MMM), Charles Schwab Stock (SCHW) and more …

Stock Market Outlook for Fri Jan 17 2025 – A Little Weakness But Still Higher

Prior Trading Day Summary: Thursday saw investors taking profits after Wednesday’s huge rally. In the final hour of trading the SPX was positive until sellers pushed back, taking profits and sending the SPX lower by 12 points to end the …

Morning Investing Strategy Notes for Thu Jan 16 2025

For FullyInformed Members the morning Investing Strategy Notes for Thu Jan 16 2025 review Wednesday’s massive rally and outlines the outlook for the rally and handling trades over the next several weeks. Stocks discussed include Taiwan Semiconductor Stock (TSM), UnitedHealth …

Stock Market Outlook for Thu Jan 16 2025 – Higher Still

Prior Trading Day Summary: On Wednesday everything fell into place as the oversold market staged a strong rally as bond yields dipped on the back of slightly weaker core CPI numbers and exceptional earnings from the first round of bank …

Morning Investing Strategy Notes for Wed Jan 15 2025

For FullyInformed Members the morning Investing Strategy Notes for Wed Jan 15 2025 review Tuesday’s volatile day of trading along with the outlook for Wednesday’s trading. Stocks discussed include TQQQ ETF, Taiwan Semiconductor Stock (TSM), UnitedHealth Group Stock (UNH), Bank …

Stock Market Outlook for Wed Jan 15 2025 – All About Bank Earnings

Prior Trading Day Summary: On Tue Jan 14 2025 stocks once more gyrated between gains and losses. The S&P was as low as 5805 and as high as 5871 before closing up 6 points to 5842. Volume dipped lower on …

Morning Investing Strategy Notes for Tue Jan 14 2025

For FullyInformed Members the morning Investing Strategy Notes for Tue Jan 14 2025 review Monday’s market action which ended with a slight gain. Stocks discussed include TQQQ ETF, Citigroup Stock (C), JP Morgan Chase (JPM), Wells Fargo Stock (WFC), Goldman …

Stock Market Outlook for Tue Jan 14 2025 – Second Bounce Likely

Prior Trading Day Summary: On Monday stocks opened lower but all 3 indexes managed to close the day higher. The SPX fell below the 100 day moving average in the morning but managed to find buyers to help push the …

Morning Investing Strategy Notes for Mon Jan 13 2025

For FullyInformed Members the morning Investing Strategy Notes for Mon Jan 13 2025 review Friday’s sell-off, the outlook for today and the week. Stocks discussed include TQQQ ETF, Walt Disney (DIS), JP Morgan Chase (JPM), Wells Fargo Stock (WFC), Citigroup …

Stock Market Outlook for Mon Jan 13 2025 – Still Bearish – Bounce Attempt Likely

Prior Trading Day Summary: On Friday investors sold stocks lower following a stronger than anticipated December jobs report which showed over 100,000 more jobs created than estimated. Many investors looked at the jobs numbers as possibility inflationary and a reason …

Morning Investing Strategy Notes for Fri Jan 10 2025

For FullyInformed Members the morning Investing Strategy Notes for Fri Jan 10 2025 review Wednesday’s market action and the outlook for Friday. Stocks discussed include Delta Air Lines Stock (DAL), Broadcom Stock (AVGO), Constellation Brands Stock (STZ), Apple Stock (AAPL) …

Subscribe For The Latest News