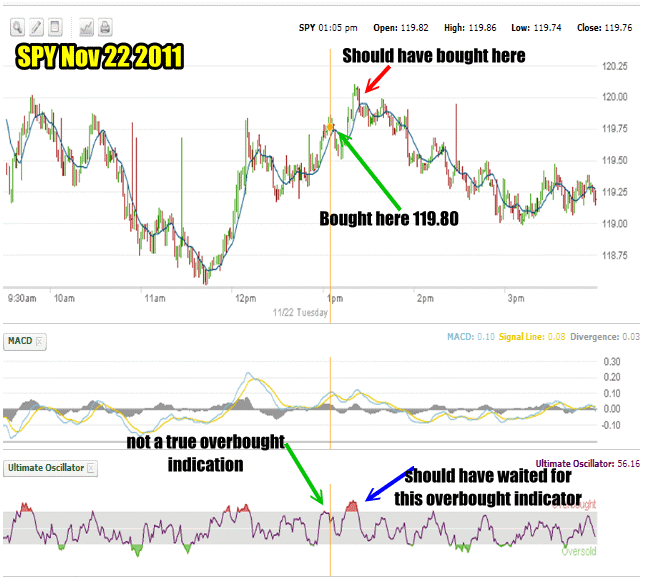
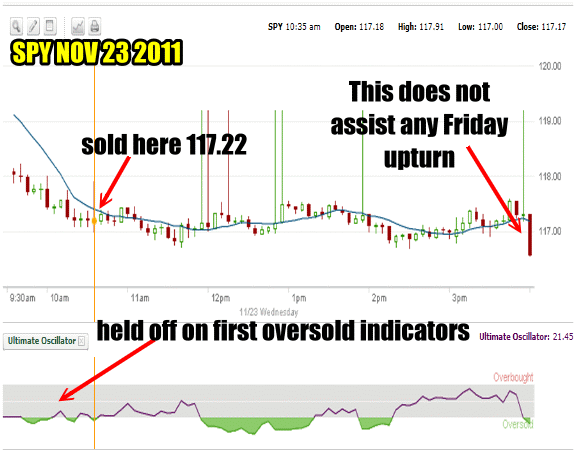
Spy Put trade continues to perform as expected in this bear market. On the options forum yesterday in the early afternoon I indicated I was purchasing my SPY PUT hedge once again. At that time the S&P had climbed into positive territory. As explained many times on my Fullyinformed website, when my market timing indicators tell me that the market direction is down, I have confidence in those market timing technicals in order to step up and put my capital at risk.
The market timing indicators continue to show market direction as down so any move into positive territory has to be suspect and taken as an opportunity to purchase SPY PUT contracts to profit when the market falls back. This is also why my cash cushion is so important. By buying and selling SPY PUT contracts during periods of weakness, I can continue to grow my cash cushion. With the cash cushion becoming larger with each successful trade, it assists me for when the SPY PUT trades do not work out and losses occur.
As well the break of the line in the sand, which I referred to in many market timing / market direction articles recently at 1200 on the S&P, broke two days ago. I explained that this break from a technical stand point is significant and will bring more selling into the market.
WHY IT’S HARD FOR INVESTORS TO BUY PROTECTION
Many investors find buying protection in stock markets a difficult task. It’s because we have all been taught to buy stocks and wait for them to rise and sell them for a profit. But that is often not the case as stocks in general fall faster than they climb. In order to break this habit of not purchasing protection, try paper trading daily to both give yourself confidence that you can buy and sell in down markets to earn income as well as create strategies that work for you and which you are comfortable with.
SPY PUT CHART FOR NOV 23 2011
No matter how long you have been investing you will make mistakes. Yesterday is a good example. I have traded the SPY PUT hedge since 1993. I should know by now to wait for a clear Overbought Indicator from the Ultimate Oscillator, however I felt rushed when I saw the market turn positive. Because of this I saw what I felt was as close to overbought as possible and bought my spy put contracts. It was a mistake. Within a short time, the market pushed higher and I then received a solid overbought indicator. That’s when I should have bought.

The Market climbed and I reacted too quickly not waiting for the proper indicator from the Ultimate Oscillator before buying my SPY PUT contracts.

SPY PUT HEDGE – Try Papertrading
There is no need to rush in and put your capital at risk when experimenting with the SPY PUT hedge. I strongly suggest paper trading. When paper trading, don’t try to second guess the moves in the market. Set the Ultimate Oscillator, 5 period SMA and MACD indicators up and then watch for the signs of overbought and oversold. At those moments buy and sell (paper trading) the spy put contracts. Keep an eye on the 5 period SMA, and MACD to confirm moves lower for exiting SPY PUT contracts.
After a few months you may begin to see a trading style emerge that you are comfortable with. Calculate how often you have been correct and how many trades have worked out. Try 5 spy put contracts and then 10 spy put contracts in your paper trading. Determine the number of spy put contracts you are comfortable with, remember that any loss will be enlarged by more spy put contracts.
View The 2011 SPY PUT Trades
View The 2010 SPY PUT Trades
