SPY PUT returned to my trading today with what ended up as a simple trade. When I indicated yesterday morning in my Market Timing / Market Direction call for Nov 8 that I thought the market could roll over, I didn’t assume it would do it in one day. But the collapse today was excellent for my SPY PUT trade and it was almost picture perfect using the ultimate oscillator yet again.
SPY PUT – GAP DOWN OPEN IS THE SIGN
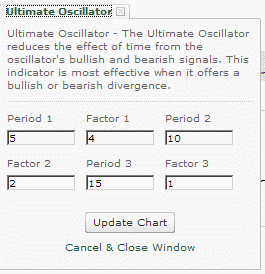
When I see a great big gap down open I immediately set up my charts to follow the S&P (SPX) and the SPY to get ready for my SPY PUT trade. I set the ultimate oscillator with the settings below and watch the 1 minute chart.

Ultimate Oscillator settings for day trading the SPY Put hedge
TYPICAL BEAR MARKET PLUNGE IS AN EASY TO PLOT ROLLER COASTER FOR THE SPY PUT
On big down days like today, the market will normally try to recover allowing me to purchase my SPY PUT contracts and then probably sell into the afternoon and perhaps have a really late rally and then sell into the close. This roller coaster is actually typical of a bear market plunge. Remember how I wrote that bear markets have spine chilling falls and hair-raising rallies. Today was a spine chilling reminder that the bear is alive and well. Today though the SPY PUT trade was text-book.
At the open it was a matter of wait for the rally and the overbought indicator on the Ultimate Oscillator. Then hold on for the oversold indicator and sell my SPY Put contracts.
SPY PUT CHART FOR NOV 9 2011 TRADE
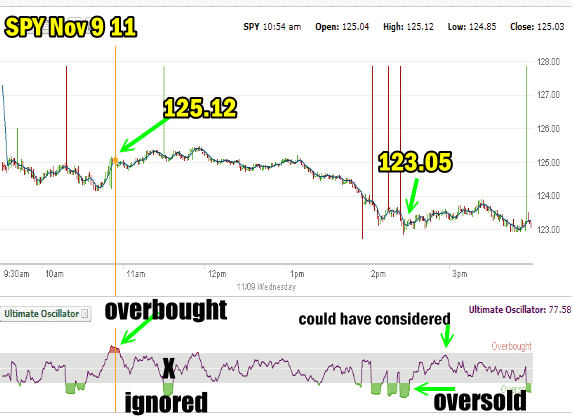
Below is the SPY Put chart for Nov 9 2011. The overbought indicator on the ultimate oscillator came before 11:00 AM. I bought 20 SPY PUT contracts and went out to Dec 17 expiry.
I picked the $125.00 and bought all 20 for $4.88. The S&P continued to rise and interestingly the SPY showed oversold around 11:30 AM. This though was caused by the little rally which followed after I bought my SPY Put contracts and then the quick selling before the market climbed higher. I ignored that oversold indicator not only because I wouldn’t have made anything in my trade but because my Market Timing / Market Direction call for yesterday indicated I was looking for a rollover in the markets, so it was a judgement call on my part whether I felt that the market would fall back lower.
THREE OVERSOLD INDICATORS – WHEN DO YOU SELL YOUR SPY PUT CONTRACTS
True to a bear market plunge, the rally began to slow and then by the afternoon the selling intensified as the market collapsed lower. There were 3 oversold indicators and I held my SPY PUT contracts until into the third oversold indicator.
This is because the second indicator did not really “fall out of bed” as it were and then when the third indicator also failed to hit the market harder I decided the bottom was perhaps in for the day and I sold my SPY PUT contracts.

SPY Put trade for Nov 9 2011
Normally on a day like today there is a rally attempt into the 3:00 to 3:30 time period as traders buy to close shorted positions, pushing stocks up and then the market often sells into the close. On the move back up to 3 PM, I marked where an investor could have considered buying puts for a move into the close as the ultimate oscillator was getting close to an overbought indicator again. I didn’t do this trade today. If you read my Market Timing / Market Direction guess for today you’ll understand why I didn’t buy spy put contracts on this last rally.
SPY PUT TRADE CONCLUSION FOR NOV 9 2011
I keep posting my SPY PUT trades so other investors can consider looking into possible ways to set up their own Portfolio hedge strategies. While my SPY PUT hedge works well for me, others use RSI (Relative Strength Index) and MACD (Moving Average Convergence / Divergence) to help in timing entry and exit points for trading the SPY Put. Select this SPY PUT link to read more about the SPYDER ETF history and performance.
I strongly urge investors to consider paper trading for a while to see what strategy works best for them. While I love the SPY PUT, it is by no means the only method for hedging against days like today.
