In the second part of the Royal Bank Stock article, I pick up in 2008 as the severe bear market is getting underway.
To understand this article you should consider reading Part 1 of Royal Bank Stock – Learn From The Bear.
ROYAL BANK STOCK – LEARN FROM THE BEAR – continued…
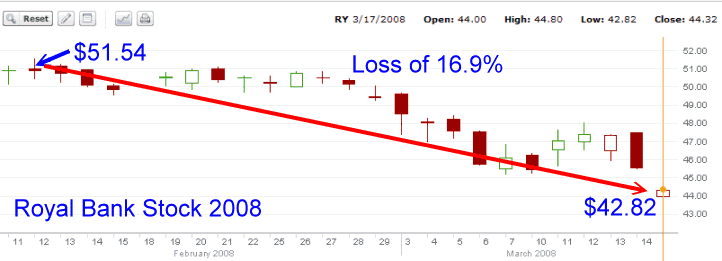
Royal Bank Stock – 2008 (first loss): Loss 16.9%
2008 would mark the worst year on record for Royal Bank Stock. The first warning sign shows in the story of Royal Bank Stock when it failed to recover to the recent high of $61.08. Investors should have seen this warning sign and acted protected against losses.
The carnage really got underway in February 2008 when within a month the stock had lost 16.9%.
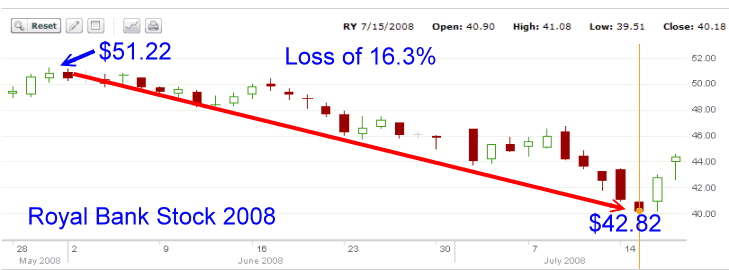
Royal Bank Stock – 2008 (second loss): Loss 16.3%
The second loss came in May 2008 when the stock had recovered to the Feb highs, only to fall 16.3% over a two month period.
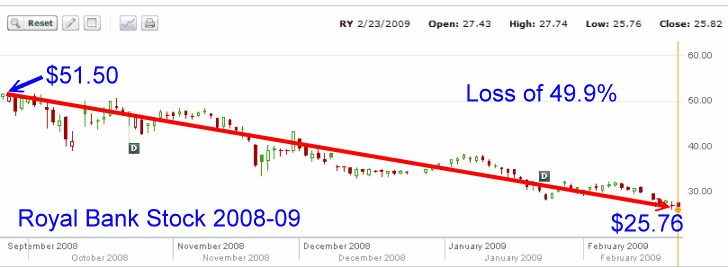
Royal Bank Stock – 2008 (third loss): Loss 49.9%
The most shocking loss of all came in September. The stock has recovered back to the $51.00 range before commencing a stunning collapse losing 49.9% or half of its value in 6 months. Royal Bank Stock was trading at levels seen back in 1999. At this point I bought a lot of Royal Bank Stock.
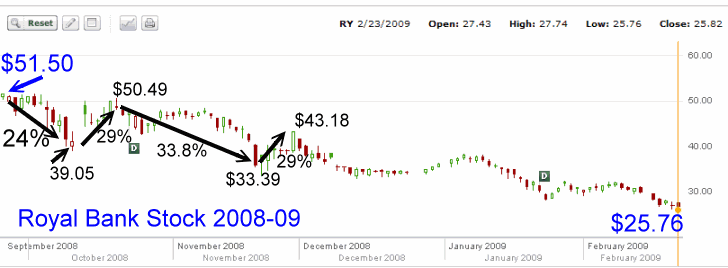
Royal Bank Stock – 2008 (review of losses)
2008 is interesting to review for Royal Bank Stock as such a severe financial bear market is rare. While the overall loss was nerve-wracking, the bear market actually afforded lots of opportunity for profit-making. This is what a bear market does best. It creates wild whipsawing and high volatility. I have plotted below the various whipsaws in Royal Bank Stock during this period. It shows that an investor could easily have traded in and out based on percentages.
Every drop in Royal Bank Stock of more than 20% could have been taken as an opportunity to buy the stock. On any move 20% back up could have been sold.
Even in the last crash after December 2008, any investor who had bought the stock after the rise back up to $43.18 (see on the chart below), would have entered back into Royal Bank Stock around $34.55. There would not have been a 20% run back up after December, but at $34.55 the stock was literally a steal. The dividend alone paid 5.7%.
If an investor had taken the time to read the past historic charts, they would have seen that collapses of 20% or greater had occurred often in Royal Bank Stock since 1998. This knowledge is what many investors plot to buy and sell stocks profitably. So while many investors were shorting the bank stocks during the financial crisis, there were others such as myself that did exceptionally well through the knowledge afforded by having read the historic charts and being aware of percentages to expect in both drops and recoveries.
Royal Bank Stock – 2010: Loss 22.3%
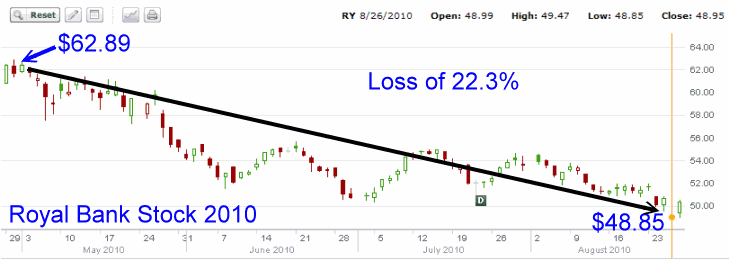
When the market recovered in 2009 Royal Bank Stock followed the market higher. While there were a number of pullbacks in 2009, none of them were significant. By May 2010 the stock had set a new all time high before collapsing 22.3% over 4 months as fear of a stalling economy prior to the Federal Reserve commencing QE2 saw steep losses in stock markets.
Notice again how the stock fell in the 20% range. Guess what I was doing at the end of August with Royal Bank Stock.
Royal Bank Stock – 2011: Loss 26.2%
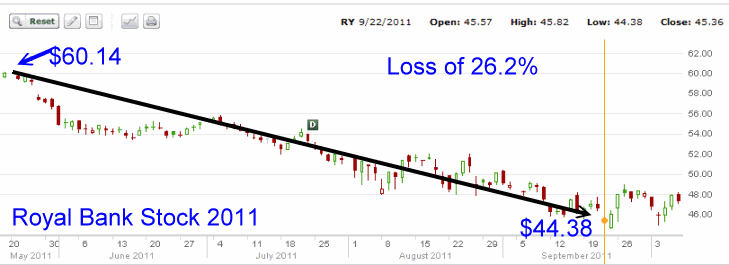
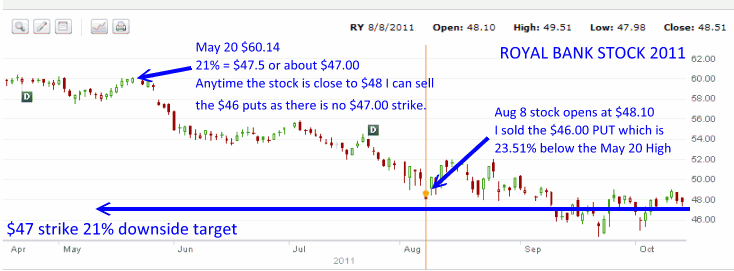
Since May 2011, Royal Bank Stock has been in another bear market. Down more than 26.2% the stock remains in bear market territory as of October 12 2011. I have bought stock in this latest downturn and I am presently holding in the money covered calls on Royal Bank Stock as well as naked puts.
Royal Bank Stock – What The Story Tells Investors
What a fascinating read Royal Bank Stock provides. As an investor I found out a number of important things including that even the best stock will get beaten down and dumped by investors. I also learned that it is pointless to chase the stock higher, but instead I should be looking for those sell-offs to buy the stock and sell calls against. Last I can see that there is never a point in buying the stock at higher valuations, but to be patient and wait for a drop before buying back in.
Just as in the JNJ Stock and CAT Stock review, all the above bear markets and severe corrections have a story to tell investors if they are willing to listen. I picked Royal Bank Stock for this third review in the Learn From The Bear series of articles because it is a large cap bank that has had a lot of corrections to contend with which makes the story of its historic charts interesting.
Let’s look at the statistics we have now uncovered about Royal Bank Stock.
1998 – 36.2% – 1 month
1999 – 28.7% – 9 months
2000 – 20.52% – 1 month
2001 – 19.65% – 4 months
2001 – 21.89% – 2 months
2002 – 20.7% – 3 months
2002 – 18.42% – 1 months
2002 – 12% – 1 month
2003 – 10% – 2 months
2003 – 8.5% – 2 months
2004 – 10.6% – 2 months
2006 – 15.2% – 2 months
2007 – 25.9% – 8 months
2008 – 16.9% – 1 month
2008 – 16.3% – 2 months
2008 – 49.9% – 6 months
2010 – 22.3% – 4 months
2011 – 26.2% – 5 months
These stats allow me to learn a few things about Royal Bank Stock.
1) The stock is more volatile than I originally thought. It is nothing like JNJ Stock or CAT Stock. It is actually more volatile with 18 collapses since 1998. After every decline the stock eventually recovers. This gives me confidence to step in and buy the stock or sell puts with the knowledge that should I be assigned, Royal Bank Stock will recover and I will get my capital back. This is the single most important aspect about investing. Preserve my capital from losses.
2) Second is that anywhere below 20% should piqué my interest to start looking at selling out of the money puts or buying the stock and selling in the money covered calls. Even if I was wrong and the stock falls further the history of the stock indicates that it will recover and in the meanwhile I am earning a very good dividend. As well there will be lots of opportunity in the future to sell my shares at higher prices.
3) Third, out of the 18 collapses in the stock only 2 were over 30%. If I drop any collapses over 30% and all those under 12%, this leaves 12 collapses. The average of those 12 collapses is 21.05%. Therefore there is no need to chase this stock. Once a selloff commences such as May of this year (2011), once the stock fell 21% I was selling puts and once it fell below 25% I bought shares for selling in the money covered calls.
This then means NO MORE CHASING THE STOCK HIGHER. The story of Royal Bank Stock proves that there is no point in chasing the stock to higher valuations. It will eventually correct or collapse affording me lots of opportunity to trade into the stock.
4) On time frame of the collapses, if I take out the longest two and the short 1 month collapses, I get an average of 3.09 months for the remaining 11 collapses.
This tells me that on average I should consider selling puts one month out and will have a good chance to roll them sideways (rolling at the same strike 1 month out at a time) for possibly two more months before the stock should begin to recover and move above my naked puts.
This is important because if I sell my Royal Bank Stock puts after the stocks falls 21% and it continues to fall, it will leave my original Royal Bank Stock puts in the money. However, based on the past charts, this will mean I should be able to buy back my Royal Bank Stock puts and roll them several times for more income while waiting for Royal Bank Stock to recover and place my puts back out of the money so I avoid assignment.
The same with Royal Bank Stock covered calls. If the stock should fall 21% or more I would consider buying Royal Bank Stock and selling in the money covered calls.
But will this strategy actually work? To answer this here are my trades from 2010 and my ongoing trades for 2011 in Royal Bank Stock.
Royal Bank Stock – 2010 Market Collapse Trades
All trades are from the TSX, are in Canadian Dollars and include Commission.
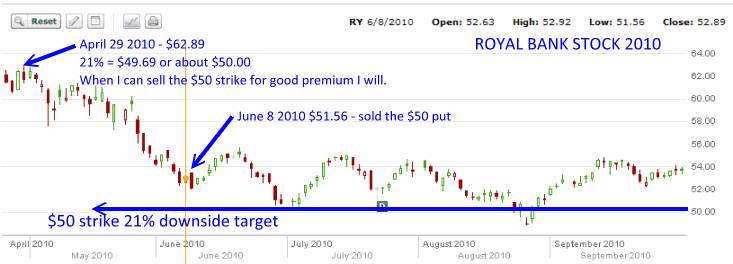
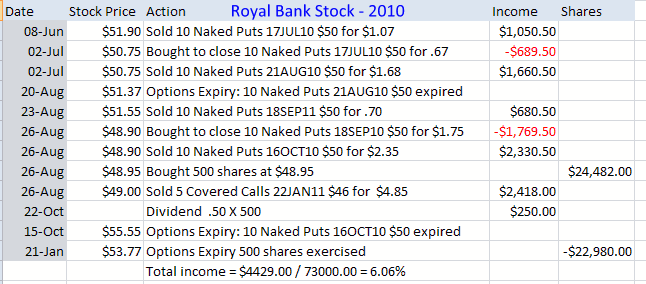
On April 29 2010 Royal Bank Stock made a new high and then commenced a sell-off. Have you ever noticed how many stocks make new highs and then sell-off. It is not unique but a very common occurrence and many investors follow the 52 week high readings on stocks looking for just such opportunities. At $62.89 I calculated that 21% retrenchment would put Royal Bank Stock around $50.00. On Jun 8 the stock fell to $51.56 and I sold the first set of $50.00 puts. Below are my trades from that period in 2010.
You can see from the charts that I rolled my $50 strike puts from August to September and then from September to October. Any opportunity when Royal Bank Stock pulled back, I took advantage of depending on the put premiums available.
I also bought stock once during this period as the stock fell into the 21% decline which according to the historic charts, is the time to buy. I then sold in the money covered calls to buy a bit more protection while at the same time earn some profit on the stock when it recovered.
Royal Bank Stock – 2011 Market Collapse Trades
All trades are from the TSX, are in Canadian Dollars and include Commission.
This is still an ongoing trade as the stock has not recovered high enough and the bear market appears to be intact presently. On May 20 the stock set a new high for the year and then commenced selling. A 21% retrenchment puts the stock at $47.50. I waited until the selling on August 8 and then sold puts as the option premiums were excellent since volatility has risen dramatically with the sell-off.
Below are the trades for this period. Remember that as the time of writing this article the trades in Royal Bank Stock are ongoing. You can see from the chart that on August 8 I sold the September $46 puts. $46.00 marks 23.5% decline in the stock. I would sell the $47 strike but there is no strike available. I have rolled the $46 puts into November from October on Oct 4 when the market sold off and pushed the stock lower.
On Sept 22 when the stock fell to $44.85 I bought 500 shares and sold 5 covered calls into November at $44.00. The covered calls on Royal Bank Stock are just slightly in the money at the time of selling. This is because $44.00 marks a retrenchment of $26.83% which from the statistics of the past years is a large retrenchment. I see no need to go lower with my covered calls. Indeed if the stock should fall lower than my $44 covered call strike I intend to roll sideways and not down as I am sure the stock will recover.
To view the last 6 months and see a bear in action select this Royal Bank Stock link for a yahoo chart.
Royal Bank Stock – Learn From The Bear Conclusion
The above spreadsheets show the possibilities for profits that exist when a stock such as Royal Bank Stock falls. These profits are all based on following the historic charts and determining valuations. Bear markets and loss in stock valuations tend to follow patterns and as you have seen in not just the Royal Bank Stock article, but in the JNJ Stock and CAT Stock articles, these collapses can be studied, analyzed and strategies devised to benefit from.
Bear markets are feared by far too many investors. Instead through taking some time to do a bit of reading, investors could uncover the often easy profits that bear markets offer. Royal Bank Stock is just one example among thousands of stocks where a little light reading will aid investors from breaking the cycle of buying stocks too high and selling them too low.


