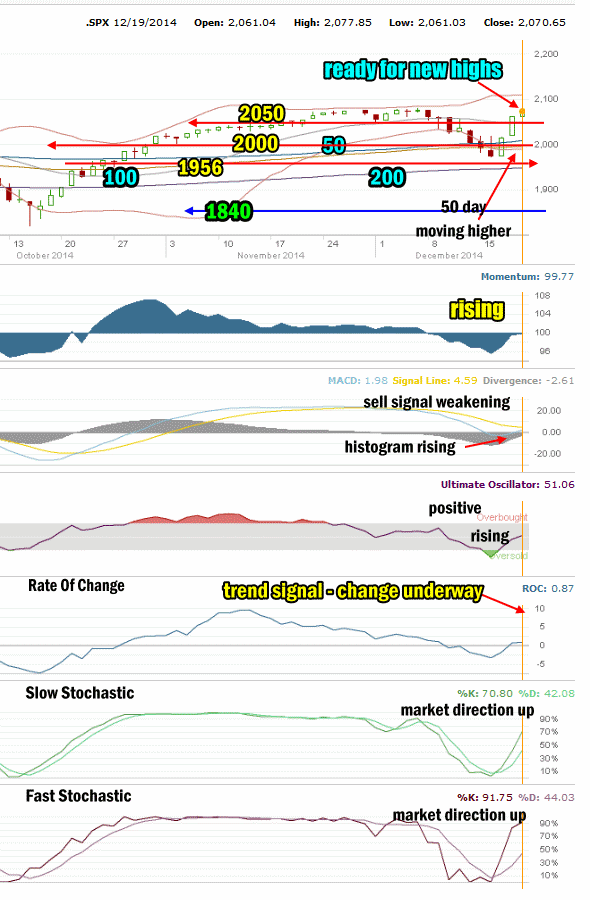
The outlook for Friday was for stocks to slow their momentum for the day but still close higher. Indeed stocks primarily spent the day trending sideways until mid-afternoon when some buying entered the market and stocks closed up just shy of half a percent, a nice finish indeed for the week.
Advance Decline for Dec 19 2014
The advance decline ratio on Friday was interesting. Just 2.2 billion shares were traded but slightly more than 2 billion of them were traded lower. That meant 93% of all issues were trading to the downside, but actual declining stocks was only 35%. New highs came in at 221 as the stocks are now reaching higher once again and new lows were just 23.
Market Direction Closings For Dec 19 2014
The S&P closed at 2070.65 up 9.42. The Dow closed at 17,804.80 up 26.65. The NASDAQ closed at 4765.38 up 16.98.
Market Direction Technical Indicators At The Close of Dec 19 2014
Let’s review the market direction technical indicators at the close of Dec 19 2014 on the S&P 500 and view the market direction outlook for Dec 22 2014.

Market Direction Technical Analysis for Dec 19 2014
Stock Chart Comments: Stocks rallied not quite half a percent on Friday but are now about 70 points above the final technical level of 2050. The 50 day is rising and moving away from the 100 day exponential moving average (EMA).
Support Levels:
Below 2050 is strong support at 2000 and weak support at 1970. Stronger support is then at 1956. 1870 and 1840 are both levels with strong enough support to delay the market falling.
The other two support levels are 1775 and 1750. I have explained that these two are critical support for the present bull market. While 1775 is important it is 1750 that is the bottom line.
A break of 1750 would mark a severe correction from the most recent high. This would be the biggest correction since April 2012. A pull-back of that size would definitely stun investors at this point and it is not something I am anticipating at this time.
Momentum: For Momentum I am using the 10 period. Momentum is negative but rising and ready to turn positive.
MACD Histogram: For MACD Histogram, I am using the Fast Points set at 13, Slow Points at 26 and Smoothing at 9. MACD (Moving Averages Convergence / Divergence) issued a sell signal on Dec 1. MACD continues negative but the readings are rising quickly now and will soon turn to a buy signal.
Ultimate Oscillator: The Ultimate Oscillator settings are: Period 1 is 5, Period 2 is 10, Period 3 is 15, Factor 1 is 4, Factor 2 is 2 and Factor 3 is 1. These are not the default settings but are the settings I use with the S&P 500 chart set for 1 to 3 months. The Ultimate Oscillator is positive and still rising.
Rate of Change: Rate Of Change is set for a 21 period. The Rate Of Change is positive and continues to point to the market trend up as having strength. The SPX will break to new highs.
Slow Stochastic: For the Slow Stochastic I use the K period of 14 and D period of 3. The Slow Stochastic tries to predict the market direction further out than just one day. The Slow Stochastic is signaling market direction is up.
Fast Stochastic: For the Fast Stochastic I use the K period of 20 and D period of 5. These are not default settings but settings I set for the 1 to 3 month S&P 500 chart when it is set for daily. The Fast Stochastic is signaling a strong up move for stocks again on Monday.
Market Direction Outlook and Strategy for Dec 22 2014
The shortened Christmas week has stocks set to push higher. The usual Santa Claus Rally is ready in waiting and should start this week. While Monday we could see a bit of weakness to start, it should be short-lived. The S&P is set to push to new highs some time this shortened week.
The market is still not overbought and has room to move further still.
Tomorrow I am expecting a higher close again and dips are opportunities for laying out trades for more upside action.
Stay FullyInformed With Email Updates
Market Direction Internal Links
Profiting From Understanding Market Direction (Articles Index)
Understanding Short-Term Signals
Market Direction Portfolio Trades (Members)
