FullyInformed.com
Generic filters
Exact matches only
Search in title
Search in content
Search in excerpt

Market Direction – NASDAQ POINTS LOWER

Sep 30, 2011 | Stock Market Outlook

Market direction is at the best of times a best guess scenario. But after 4 decades of investing I know a market in trouble when I see it.

The NASDAQ market is pointing to lower lows and signalling that the market is in serious trouble. The news from Germany was reasonably good news as was the revised USA GDP at 1.3%. Unemployment news wasn’t as bad as expected, although at this point I would take any numbers mentioned as verging on sheer gossip. Housing despite what the numbers may show is I believe in worse shape than earlier this year.

But it is the NASDAQ that I have focused on for the past month and it is not performing as well as the DOW or S&P. In fact there are bear flags everywhere warning that the market direction is DOWN.

MARKET DIRECTION – The NASDAQ Points Lower

Yesterday (Sep 29 2011) was among the worst. At one point the opening gain of 2% ended up as a loss of 2.3% before the NASDAQ recovered to close down 1.6%. In other words, the NASDAQ swung 4.3% in the day. Only 5 NASDAQ stocks set new highs while 211 hit new lows. Think about – 211 hit NEW LOWS. You can view the NASDAQ highs and lows here. (Note this link goes through an ad first)

You can also view the market direction of the last 6 months of the NASDAQ through this link. (Note this link goes through an ad first)

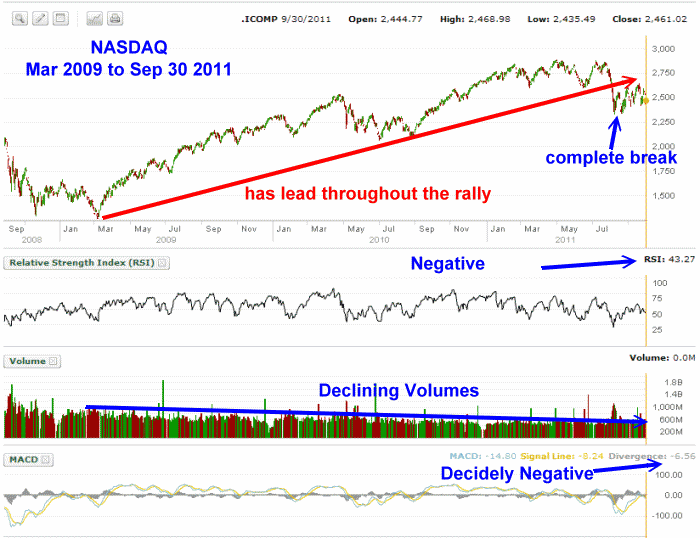
The NASDAQ led this recovery from the March 2009 lows. In the chart below you can see the great recovery in the NASDAQ which moved ahead of the Dow Jones and S&P 500, leading both those indexes higher.

That move has stopped. Relative Strength Index remains negative, volumes are declining and have been for some time, and MACD (Moving Average Convergence / Divergence), is decidedly negative with a reading of negative 6.56.

All of this is telling investors a lower low is coming.

Market Direction NASDAQ chart March 2009 to Sep 30 2011

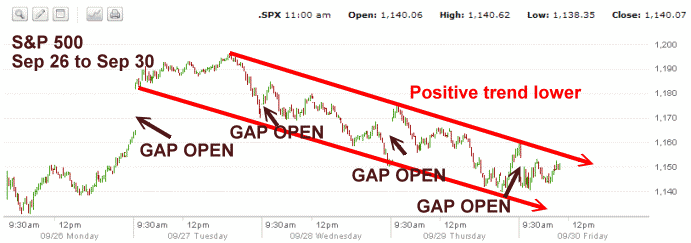
Here is the S&P 500 chart for just the past 5 days. Every day has seen a gap open. These are all bear signs. The positive trend is LOWER.

Market Direction - S&P500 Sep 26 to Sep 30

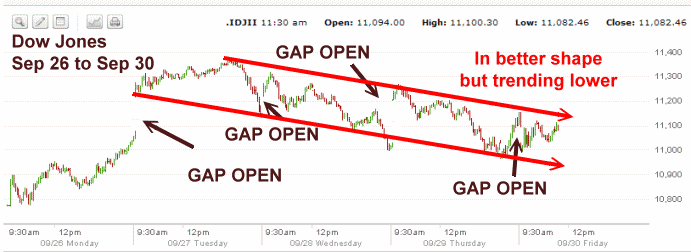
Here is the Dow Jones Chart for the last 5 days. The Dow Jones is in better shape than either the S&P or the NASDAQ charts, but again the market direction trend is positively LOWER.

Market Direction - Dow Jones Sep 26 to Sep 30 2011

Market Direction Summary – Mid-Day On Sep 30 2011 – Lower Lows Coming

I reported in my market direction call last night that the August 9th low will be broken by the constant nervousness of investors. Every pullback investors who bought at the August 9th low are becoming increasingly alarmed.

This means that each pullback has seen less and less support. The NASDAQ is telling investors that the market direction is lower and it will break the August 9th lows.

I bought SPY Puts this morning on the market rise. This market will move lower before it establishes a new support zone. I still believe the S&P 500 will try to find support around the 1000 level. That is still about a 140 points lower or 10 to 12 percent lower. I have purchased SPY Puts this morning which I may hold over the weekend.

The market direction I believe has become clearer with this last half-hearted rally and it is definitely lower.

Recent Outlooks

Stock Market Outlook for Tue Apr 8 2025 – Bounce Likely But Highly Suspect

Prior Trading Day Summary: Monday saw a wicked start to the day but a rumor on a delay in implementing tariffs stopped the selling despite the White House denying the rumor. In a dramatic reversal the indexes all rallied strongly …

Morning Investing Strategy Notes for Mon Apr 7 2025

For FullyInformed Members the morning Investing Strategy Notes for Mon Apr 7 2025 review the continued sell-off on Friday and the outlook for Monday with stock futures showing a large decline to start the week. Today’s Investing Strategy Notes focus …

Stock Market Outlook for Mon Apr 7 2025 – Bounce Possible At Any Time But Still Bearish and Lower For Now

Prior Trading Day Summary: One word described Friday April 4 2025 – Brutal. The S&P collapsed 322 points ending the day at 5074. For the week the S&P was down 507 points. Truly stunning developments and pushing the SPX through …

Morning Investing Strategy Notes for Fri Apr 4 2025

For FullyInformed Members the morning Investing Strategy Notes for Fri Apr 4 2025 review the collapse of stocks on Thursday and the outlook for Friday. Stocks discussed for today include the SPY ETF, the VIX.  TQQQ ETF, SQQQ ETF and …

Stock Market Outlook for Fri Apr 4 2025 – All About The March Jobs Numbers

Prior Trading Day Summary: Thursday saw stocks collapsing worldwide following higher than expected tariffs from President Trump. At was a brutal day, the worse single day since 2020. The SPX closed down 274 points to 5396 on 7.3 billion shares …

Morning Investing Strategy Notes for Thu Apr 3 2025

For FullyInformed Members the morning Investing Strategy Notes for Thu Apr 3 2025 review the outlook for stocks after tariffs were announced on Wednesday. Stocks discussed for today include Chevron Stock (CVX), Exxon Mobil Stock (XOM), VIX ETF, TQQQ ETF, …

Stock Market Outlook for Thu Apr 3 2025 – Bearish Following Higher Than Expected Tariffs

Prior Trading Day Summary: On Wed Apr 2 2025, investors rallied stocks for a third day on hope that the tariffs being introduced would be lower than many expected. As we found out after the market closed, the tariffs were …

Morning Investing Strategy Notes for Wed Apr 2 2025

For FullyInformed Members the morning Investing Strategy Notes for Wed Apr 2 2025 review the second higher day on Tuesday. Stocks discussed for today include VIX ETF, TQQQ ETF, SQQQ ETF, RH Stock (RH) and more. The morning Investing Strategy …

Stock Market Outlook for Wed Apr 2 2025 – Tariffs Day – Still Bearish – Bounce Attempt Likely

Prior Trading Day Summary: On Tue Apr 1 2025 stocks sold lower before finding some buyers. By the close the SPX and NASDAQ were back positive. The SPX closed up 21 points to 5633 on 4.5 billion shares traded. The …

Morning Investing Strategy Notes for Tue Apr 1 2025

For FullyInformed Members the morning Investing Strategy Notes for Tue Apr 1 2025 review the afternoon rally from Monday. Stocks discussed for today include VIX ETF, TQQQ ETF, SQQQ ETF and more. The morning Investing Strategy Notes are for FullyInformed …

Stock Market Outlook for Tue Apr 1 2025 – Nice Bounce But Still Bearish

Prior Trading Day Summary: On Mon Mar 31 2025 stocks seemed headed for another low until buyers finally returned. The index bounced and the SPX closed up 31 points to 5612. Volume was good at 5.3 billion shares and by …

Morning Investing Strategy Notes for Mon Mar 31 2025

For FullyInformed Members the morning Investing Strategy Notes for Mon Mar 31 2025 review the continuation of the sell-off. Stocks discussed for today include VIX ETF, TQQQ ETF, Lululemon Athletica Stock (LULU) and more. The morning Investing Strategy Notes are …

Stock Market Outlook for Mon Mar 31 2025 – Bounce Attempt Likely But Still Bearish

Prior Trading Day Summary: On Fri Mar 28 2025 stocks plunged lower without any large rally attempt. This lead to more selling which saw the index close near the day’s low. The SPX lost 112 points and ended the week …

Morning Investing Strategy Notes for Fri Mar 28 2025

For FullyInformed Members the morning Investing Strategy Notes for Fri Mar 28 2025 review the state of the market. Stocks discussed for Thursday include VIX ETF, TQQQ ETF, Lululemon Athletica Stock (LULU) and more. The morning Investing Strategy Notes are …

Subscribe For The Latest News