The market direction outlook for Monday was for the markets to try for a higher close, even if just marginally. The advance decline ratio of stocks hitting 52 week highs or lows was so close on Friday that when combined with the technical indicators, it did appear that stocks had just enough strength to hang on and try for a higher close, but not enough momentum or energy to move the overall market direction much higher.
Market Direction S&P 500 Intraday For Nov 11 2013
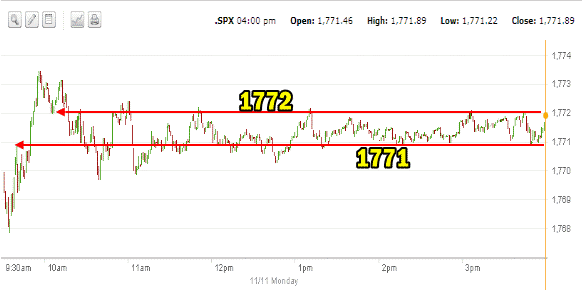
Today the bond market and banks were closed for Remembrance Day. This always tends to make for flat trading for stocks. The stock markets are small in relation to the bond market so it is never surprising when stocks stay flat when bonds are not trading. The intraday one minute chart below shows the market direction action for Nov 11. You can see how flat the market was today. While this may seem like an uneventful day, it actually shows reasonable strength remains in the market direction. Despite moving sideways all day, the market never sold off and that is important.

Advance Declines For Nov 11 2013
Advancing issues outpaced decliners but again just barely. Advancing issues were 50% and decliners came in at 46%. New highs are still low at 137 versus 95 new lows.
Market Direction Closing For Nov 11 2013
The S&P 500 closed at 1,771.89 up 1.23. The Dow closed at 15,783.10 up 21.32. The NASDAQ closed at 3,919.79 up 0.56. The IWM ETF was almost unchanged at 109.38.
Market Direction Technical Indicators At The Close of Nov 11 2013
Let’s review the market direction technical indicators at the close of Nov 11 2013 on the S&P 500 and view the market direction outlook for Nov 12 2013.

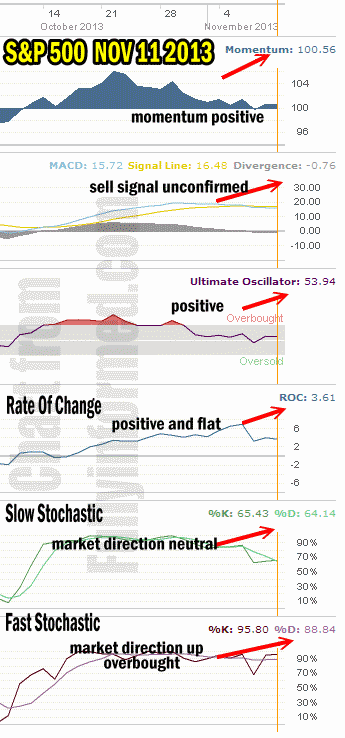
For Momentum I am using the 10 period. Momentum is still positive but unchanged from Friday.
For MACD Histogram I am using the Fast Points set at 13, Slow Points at 26 and Smoothing at 9. MACD (Moving Averages Convergence / Divergence) issued a sell signal on Nov 7, but it was not confirmed on Friday and again today. In fact today the MACD signal came is at negative 76 which is a continual improvement in the signal.
The Ultimate Oscillator settings are Period 1 is 5, Period 2 is 10, Period 3 is 15, Factor 1 is 4, Factor 2 is 2 and Factor 3 is 1. These are not the default settings but are the settings I use with the S&P 500 chart set for 1 to 3 months.
The Ultimate Oscillator is positive flat.
Rate Of Change is set for a 21 period. The Rate Of Change moved sideways today.
For the Slow Stochastic I use the K period of 14 and D period of 3. The Slow Stochastic is signaling that the market direction is neutral and it is not overbought.
For the Fast Stochastic I use the K period of 20 and D period of 5. These are not default settings but settings I set for the 1 to 3 month S&P 500 chart when it is set for daily. The Fast Stochastic is signaling that the market direction is up for Tuesday and it is extremely overbought after Friday’s big push higher.
Market Direction Outlook And Strategy for Nov 12 2013
The best thing to say about today’s market direction was that there was no sell-off. Aside to that though there was also no real follow through from Friday’s big move higher. This though has not been uncommon with the stock market direction throughout 2013. Big moves higher are often followed by sideways actions and then another jump up. Looking at the market direction technical indicators, there does seem to be enough consensus for the market direction to move higher tomorrow.
MACD though is negative but the readings are becoming less negative as there has been no confirmation of a move lower. Meanwhile rate of change is flat which again reflects back to the present market direction. Even the slow stochastic which is not overbought, is signaling a neutral outlook for later in the week.
I am continuing with my Put Selling strategies and have not reduced the amount of capital I have for stock and option use. I am though being selective as I do not want all my available capital placed just in case the market direction does pull back. Any pull back will definitely create opportunities.
If there is a correction, there are not too many signals that are advising that it will be shortly. A correction though could happen at any time as the momentum to the upside has slowed considerably from the start of this latest rally. Right now analysts believe if there is a correction it will be very shallow. I am not sure this will be the case as we have not had a serious correction this entire year so a 3 to 5 percent correction might just catch investors unaware.
For Tuesday I am looking for stocks to try to push higher even if once again just marginally, and I am continuing to look for more Put Selling opportunities.
Market Direction Internal Links
Profiting From Understanding Market Direction (Articles Index)
Understanding Short-Term Signals
Market Direction Portfolio Trades (Members)
