The market direction outlook for Tuesday was more upside for stocks. This movement higher in all the indices has drawn considerable capital into the markets this month and this year. A recent report on Marketwatch indicated that $277 billion has poured into stocks this year and over $40 billion this month alone. There are many analysts who are becoming concerned that this can only end badly for the majority of investors. Another interesting article explained that the likelihood of a black swan type event has doubled in the past year. A black swan type event is a crash or severe pull back that investors are unprepared for and has very few warnings signs. He pointed to the market collapse in 2000 as such an event.
Market Direction Collapse of 2000
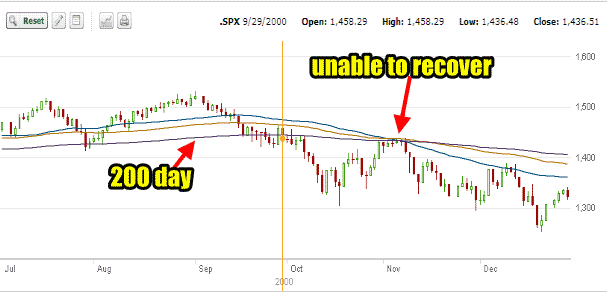
I have to disagree. Most market collapses have plenty of signs but few investors are watching. Even fewer investors know how to react. The majority sit and watch stock valuations collapse with no idea how to not only stop the losses but how to profit from the collapse. The chart below is from the summer of 2000. You can see that at the end of July and start of August the S&P broke through the 200 day moving average and then recovered. In mid- September 2000, the S&P again fell below the 200 day moving average. The push back in November failed to recover the 200 day moving average and you can see a very strong sell signal on November 8 and 9 when the 50 day simple moving average (SMA) and 100 day exponential moving average (EMA) both collapsed below the 200 day exponential moving average (EMA). This is text book investing. Within a year the S&P was down to 768 in October 2001.

Present Stock Market Direction
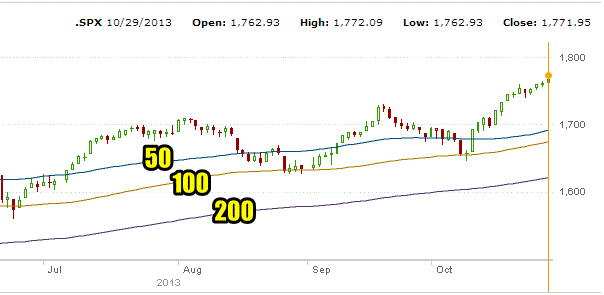
At present there are no such warning signs or signals. The market continues to stay far above the 200 day exponential moving average (EMA) which for every market since before 1929 has been one of the very best, if not the best, signal that a market direction change to the downside is underway. At present therefore I see no signs that the market direction even at the present lofty heights is about to collapse. I believe there will be signals to advise when it is time to turn fully defensive but that time is not yet.

Market Direction S&P 500 Intraday For Oct 29 2013
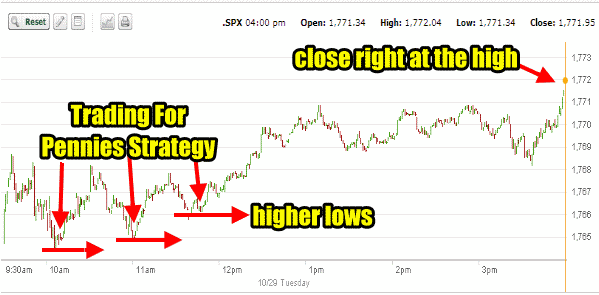
The intraday 1 minute chart for the S&P 500 for Tuesday shows once again the typical morning pattern. Today there were four dips, each of which was highigh. All three worked for the Trading For Pennies Strategy. Two of the trades I posted to twitter while engaged in them. Meanwhile the market closed right at the highs. This is bullish but often it can be followed next day by some weakness in the morning so we will have to watch for this on Wednesday.

Advance Declines For Oct 29 2013
The advance – decline ratio favored advancers with 59% advancing and 37% declining. This is lower though the 70% advancing and continues to show the overbought nature of the present market. There were 766 new highs again today versus 117 new lows. The market remains is continuing to push higher which can be seen by the numbers but the strength of the push is under pressure as it keeps climbing. There should be a pull back anytime soon.
Market Direction Closing For Oct 29 2013
The S&P 500 closed at 1,771.95 up 9.84 to another new high. The Dow closed at 15,680.35 up 111.42 and ready to challenge the all-time high. The NASDAQ closed at 3,952.34 up 12.21 and another new 13 year high. The IWM ETF closed up 32 cents to 111.32 and set a new intraday high at 111.62.
Market Direction Technical Indicators At The Close of Oct 29 2013
Let’s review the market direction technical indicators at the close of Oct 29 2013 on the S&P 500 and view the market direction outlook for Oct 30 2013.

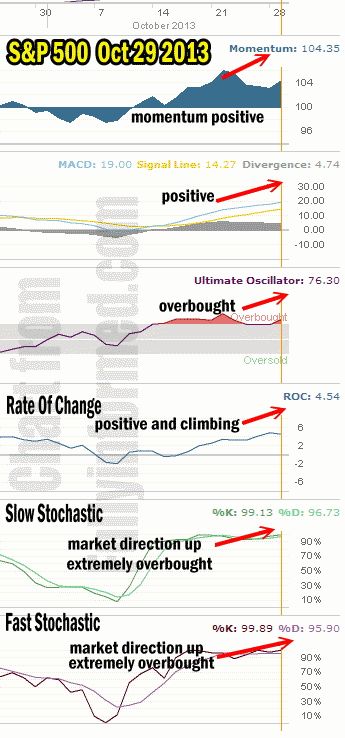
For Momentum I am using the 10 period. Momentum is still quite positive and today moved higher.
For MACD Histogram I am using the Fast Points set at 13, Slow Points at 26 and Smoothing at 9. MACD (Moving Averages Convergence / Divergence) issued a buy signal on Oct 14. The signal continued strong today but once again there was not really a significant change. Instead the reading is almost exactly the same as Monday’s.
The Ultimate Oscillator settings are Period 1 is 5, Period 2 is 10, Period 3 is 15, Factor 1 is 4, Factor 2 is 2 and Factor 3 is 1. These are not the default settings but are the settings I use with the S&P 500 chart set for 1 to 3 months.
The Ultimate Oscillator is back climbing higher into overbought territory.
Rate Of Change is set for a 21 period. The Rate Of Change is once more flat.
For the Slow Stochastic I use the K period of 14 and D period of 3. The Slow Stochastic is signaling that the market direction is up and it is still extremely overbought.
For the Fast Stochastic I use the K period of 20 and D period of 5. These are not default settings but settings I set for the 1 to 3 month S&P 500 chart when it is set for daily. The Fast Stochastic is signaling that the market direction for Wedneday is up. It remains extremely overbought as well.
Market Direction Outlook And Strategy for Oct 30 2013
For Wednesday the market direction technical tools are still quite positive but there are some signs that the rally may be about to slow. MACD cannot get higher and instead is slowing falling lower. The readings are not significant enough to cause concern but they should be rising if the market is to continue to push higher with conviction. Both stochastic indicators are still showing up but the D signal readings of both continue to climb as well indicating a growing pressure to the downside is building. Rate of change is back flattening out once again showing that fresh capital is not flowing in today. Last the Ultimate Oscillator has moved higher back into extreme overbought.
All the above are not big concerns yet but they do show that the move higher is under increasing pressure and eventually it will have to pull back once again and consolidate. It could though be higher but my outlook for tomorrow is for stocks to return to a more sideways advance again and I will not be surprised to see some weakness in the morning after the S&P 500 closed right at new highs.
For Wednesday then I believe we could see a sideways action with the bias remaining still strongly to the upside.
Market Direction Internal Links
Profiting From Understanding Market Direction (Articles Index)
Understanding Short-Term Signals
Market Direction Portfolio Trades (Members)
