Today’s action by the Fed Chairman Bernanke is another example of how events shape the market. Studying market direction by technical indicators allows me to predict with a degree of certainty what the stock market may do next day or even for the week, but there are numerous events that cannot be predicted. Over the past several days I wrote in my market direction outlook that if the Fed decided not to scale back Quantitative Easing this month it would most likely be the catalyst to continue the rally. Meanwhile many analysts felt that this was already built into the market direction while most analysts were expecting a the so-called tapering to be announced and start this month.
Inflation
Whereas most analysts are looking at the unemployment and economic picture of the US as the main drivers of Fed tapering, I think Bernanke made it very clear today in his comments that the big concern is not so much the economic growth as it is the lack of inflation. The amount of printing of money done by the Federal Reserve should, by historic theory, have pushed up inflation. Gold itself has been expecting inflation which is why it has risen so much since the last bear market. But one clue as to the Fed worries was contained in a very short part of Bernanke’s comments when he mentioned the “aging population” and how this may be a factor in inflation.
The Lesson Of Japan
The lesson of Japan should be well-known by now for most major economies. Japan has a rapidly aging population and has been in a recession for more than 20 years. The deflation facing Japan is caused by many factors but one of them is the aging population. In the most simple of terms, seniors tend to spend less money and worldwide the baby boom generation, the largest generation the world has ever known, are entering their senior years. Every industrial power is facing the same prospects. Therefore while the fear of relentless printing of money is that it causes inflation, this is all based on a handful of historic periods in which countries faced hyper inflation caused by the overprinting of their currencies, but none had the economy of the US.
US Printing Of Money
No country in the world or in history has ever printed money on the scale of the Federal Reserve since the credit crisis commenced in 2008. When this liquidity was pushed through the world’s markets to try to stabilize the banking systems no one knew what the results would be. Inflation was a concern of most economists who wrote and spoke out against the “madness” of printing money. But no industrial power the size of the United States has ever undertaken what the Federal Reserve has put in place and no nation with the economic strength and diversity of the United States has ever entered into this kind of Quantitative Easing. Following the US example, Europe and now Japan have both embarked on the same path and in all three, inflation as measured by government sources remains extremely low. The concern then for the Federal Reserve seems clear after Bernanke’s comments today. It is deflation and it probably was one of the crucial aspects of their liquidity programs.
It Is Deflation and Inflation We Should Watch
Following today’s comments by Fed Chairman Bernanke, I believe as investors we should be watching inflation numbers as well as the unemployment and economic stats. Without inflationary growth, the chance of interest rates rising much is probably quite small. Ever since the Fed announcement in the early summer that they may be considering scaling back the Quantitative Easing programs interest rates on T-Bills and such have risen and interest sensitive stocks like utilities have fallen. Today’s announcement may push interest rates back down. It did push Utility Stocks higher.
Lululemon Stock Rally Is Back
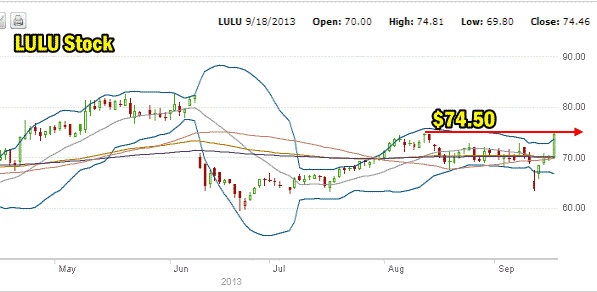
A couple of stocks I want to mention this evening include Lululemon stock which yesterday I had written I was expecting the rally to end and the stock to move lower. This was far from the case as the stock pushed up over 6 percent and closed near the highs for the day at $74.46. The question now is whether this top which is the same top as the previous rally which ended mid-August, will break higher or not. My instincts tell me it will not, but there is a lot of buying and a huge short position in the stock. Today could have seen a lot of short positions being covered. Still though I have no plans to be Put Selling this stock at this level or anywhere near $70.00. It must build solid support before I would consider Put Selling it above $67.50.

Intel Stock Is Continuing The Uptrend
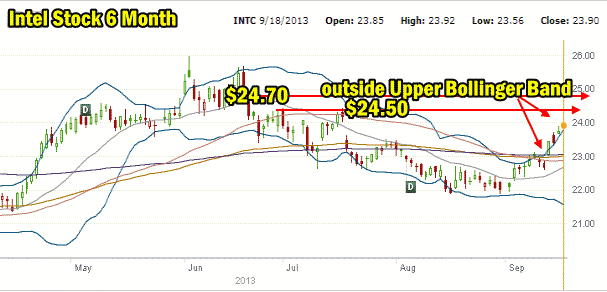
Intel stock is continuing to trade outside the Upper Bollinger Band and volume has been very good. There are two key resistance levels for Intel stock to break through. The first is at $24.50 and the second at $24.75. All indications point to higher prices. Top end could be $25 though if the next quarterly numbers arrive and continue to point to softening sales. For Put Selling I wouldn’t touch the stock for Put Selling above $23.00 but $22.00 would be my favorite choice.

Market Direction Action for Sep 18 2013
There is no need of a chart for today. The market direction is well-known to investors for today. The market was weak pending the Fed announcement and then as the news was released at 2:00 PM the market direction shot up and stayed up into the close. The S&P 500 set a new all time high closing at 1725.52 and was up to 1729.44 during the height of the euphoria. The Dow also set a new record and the NASDAQ closed at its highest level since 2000.
Advance Declines For Sep 18 2013
Today we had another good day for advancing issues as they were up 84% and declining issues were 15%. New highs were an incredible 568 versus 161 new lows. Investor enthusiasm for stocks is obvious in these figures.
Market Direction Closing For Sep 18 2013
The S&P 500 closed at 1,725.52 up 20.76. The Dow closed at 15,676.94 up 147.21 for yet another double-digit day. The NASDAQ closed at 3,783.64 up 37.94.
Market Direction Technical Indicators At The Close of Sep 18 2013
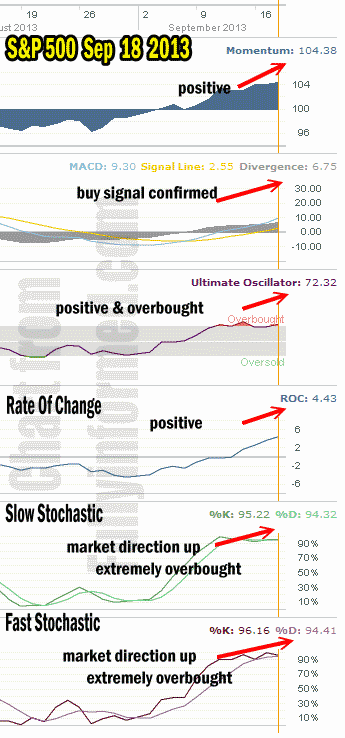
Let’s review the market direction technical indicators at the close of Sep 18 2013 on the S&P 500 and view the market direction outlook for Sept 19 2013.

For Momentum I am using the 10 period. Momentum is positive and turned higher today but not overly so despite the big rally in the afternoon.
For MACD Histogram I am using the Fast Points set at 13, Slow Points at 26 and Smoothing at 9. MACD (Moving Averages Convergence / Divergence) issued a buy signal on Sep 9 which was confirmed on Sep 10. MACD continued to climb today.
The Ultimate Oscillator settings are Period 1 is 5, Period 2 is 10, Period 3 is 15, Factor 1 is 4, Factor 2 is 2 and Factor 3 is 1. These are not the default settings but are the settings I use with the S&P 500 chart set for 1 to 3 months.
The Ultimate Oscillator is still very overbought.
Rate Of Change is set for a 21 period. The rate of change is continuing to climb as it reflects the growing enthusiasm for stocks by investors. Once this gets a bit higher I will be looking for the market direction to soften again.
For the Slow Stochastic I use the K period of 14 and D period of 3. The Slow Stochastic is signaling that the market direction is up but not overly. It is extremely overbought.
For the Fast Stochastic I use the K period of 20 and D period of 5. These are not default settings but settings I set for the 1 to 3 month S&P 500 chart when it is set for daily. The Fast Stochastic is extremely overbought and the signal tonight is also up.
Market Direction Outlook And Strategy for Sept 19 2013
For Thursday we get my favorite statistic, the Weekly Initial Unemployment Insurance Claims. They should also readjust last Thursday’s claims as well since they were off due to some non-reports. The market direction technical indicators continue to reflect an overbought market. Almost every indicator is signaling overbought and after today’s rally I would expect some consolidation.
Nonetheless I have looked for consolidation twice over the past week with success only on the one day. Still though today was a big market direction up move and as the rally continues to push into new virgin territory, investors have to be somewhat cautious. Therefore I think tomorrow could start off slow and see weakness but I don’t think the afternoon will be all that better. I think the market direction needs a chance to take a breather and tomorrow could be that day.
Right now though I see nothing I am concerned about and I am continuing to do Put Selling and place more capital at risk. The 1680 and 1670 levels on the S&P 500 are at present the only levels I am watching in case the S&P 500 pulls back to them. If that should happen that will mark a definite change. Until then I see nothing that points to any significant correction and obviously September is probably going to enter the history books as one terrific month. All this, thanks to the Fed. I must remember to send out a thank you card.
Market Direction Internal Links
Profiting From Understanding Market Direction (Articles Index)
Understanding Short-Term Signals
Market Direction Portfolio Trades (Members)
