In the longest winning streak since July the S&P 500 market direction is now up 3.4 percent over the past 7 sessions and today the S&P 500 held the 1680 level. Some of the enthusiasm for stocks stems from President Obama’s televised address from Tuesday evening which seemed to indicate that an air strike was not imminent and could in fact be called off. The one big cap stock that stood out today was of course Apple Stock. Apple Stock was pummeled today losing 5.4 percent and closing at $467.71. This was among the worst performances for Apple Stock since mid-April. In market capitalization, today’s decline was $23 billion which is about the total size of Dell.
Apple Stock
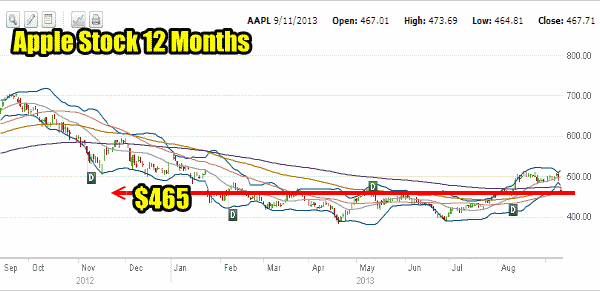
I spent almost the entire day answering over 100 emails from investors who are deeply troubled with Apple Stock. For myself, I rolled down my $480 naked puts in two steps during the day but this does not mean I am concerned about Apple Stock. It is in keeping with consistent investing to roll down my strikes when they are broken. Most investors who emailed are seeking confidence that their stock is not about to be wiped out. While I am not a financial planner and my website is not financial advice, I believe this is a temporary set back for Apple Stock. Over the past three years, every announcement by Apple has been met with selling. Yet within two weeks the stock has been higher. If that holds true again then today’s selling which saw Apple Stock break $465.00 before closing at $467.71, should be higher than $467.71 within a couple of weeks. I noted that Carl Icahn announced that he had purchased more shares of Apple Stock in the sell-off and called it a “no-brainer” to be buying more.
Personally I can see a lot of support within Apple Stock at $465.00, but I have no interest in owning shares. Whether it is a “no-brainer” to be buying, I do think there was excellent put premiums to be sold today and that is why I took advantage and rolled lower. The 12 month chart below shows where I believe a lot of support rests for Apple Stock.
I have a larger article I will be posting tomorrow on the members website which looks at my roll downs from today and how to do roll downs on naked puts when a stock such as Apple Stock tumbles like it did today. One thing about Apple Stock is the option premiums are so good that rolling down is easier. I will explain this in an article tomorrow but suffice to say that Apple Stock has a lot of value and at this point I am not concerned about today’s decline and I will be continuing the bi-weekly Put Selling strategy on Apple Stock. More on Apple Stock tomorrow.
Microsoft Stock
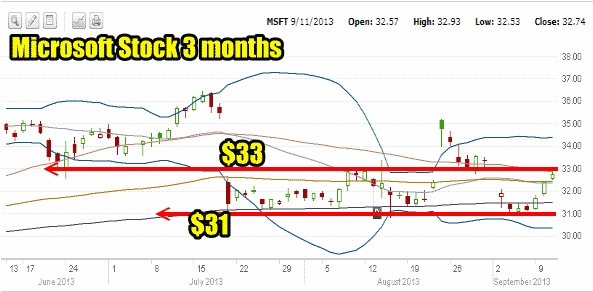
Meanwhile one other stock to mention this evening is Microsoft Stock. Here is another tech stock that took quite the tumble just 7 trading days ago. At that time I wrote that $31 held tremendous support for Microsoft Stock and I sold the $31 naked puts on August 29 and again on Sept 5. Today I closed the naked puts I sold on September 5 for 8 cents. To sell naked puts with not just consistent success but excellent returns means having confidence in the stock being sold against. This is part of the reason I stay with large cap stocks. When Microsoft Stock collapsed on September 3, again many investors emailed who had sold naked puts at $34 and $33 strikes. They worried about staying with the stock or whether they should take losses. Instead by understanding the stock being used for Put Selling, investors would have known to stay consistent with their trading. Today a number of those investors emailed me to say thanks for helping them stay confident in the stock and today many of them closed their $33 strike naked puts for .65 and .70 cents whereas just a few days ago they were considering closing these same positions for huge losses. Confidence is key when Put Selling. At this point now I am waiting for the stock to pull back again before Put Selling the $31 strike further.
Market Direction Action for Sep 11 2013
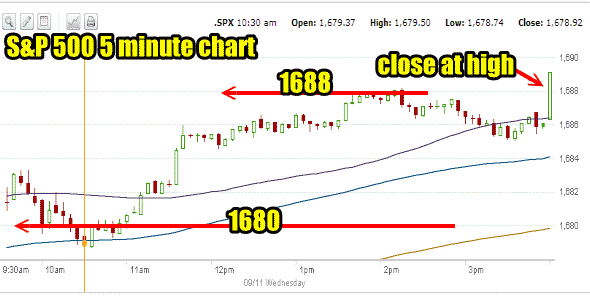
Today’s 5 minute chart is interesting when looking at today’s market direction. Last night I had written how the S&P had broken through 1680 too easily and it would probably have to pull back and test that level. Today at the open the S&P by 10:30 had fallen back below 1680. When support held the market direction turned right around and pushed almost non-stop to 1688. A slight dip at the end of the day was quickly bought by investors who pushed the S&P to close at the high for the day. This has pushed the S&P 500 into a stronger overbought condition, but it was nice to see.
Market Direction 3 Month Chart
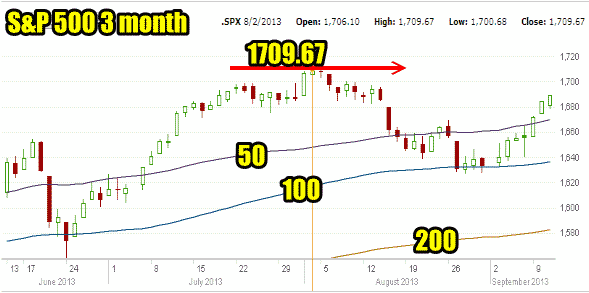
The market direction chart for the past 3 months is below. The S&P market direction is now pushing away from the 50 day simple moving average (SMA). We have had steady up days and once more the market is within striking distance of the all time intraday high of 1709.67. I don’t believe we will make it there tomorrow or even Friday but probably next week will see this high broken.
Advance Declines For Sep 11 2013
While the market direction up is impressive, volume continues to be somewhat light. Today just 5.63 billion shares changed hands which is below the average 6.25 billion.
With today’s rise the number of advancing stocks versus declining stocks was not as high as yesterday with just 58% of stock advancing versus yesterday’s 64%, and 40% of stock declining versus 34% yesterday, but the new highs today was 254 versus new lows of 145. This was fewer new highs and more new lows than yesterday.
Market Direction Closing For Sep 11 2013
The S&P 500 closed at 1,689.13 up 5.14. The Dow closed at 15,326.60 up 135.53 for yet another double-digit gain. The NASDAQ closed at 3,725.01 down 4.01 due to Apple Stock.
Market Direction Technical Indicators At The Close of Sep 11 2013
Let’s review the market direction technical indicators at the close of Sep 11 2013 on the S&P 500 and view the market direction outlook for Sept 12 2013.
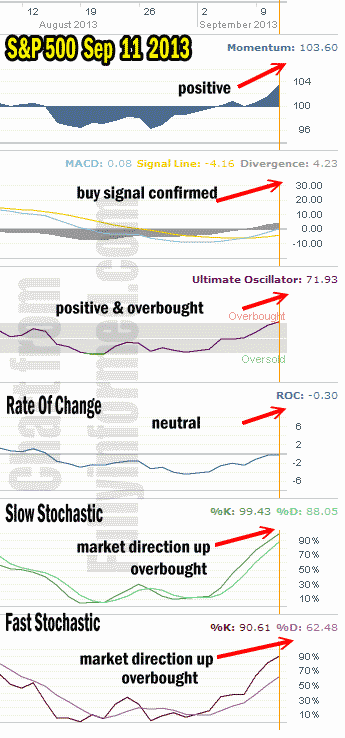
For Momentum I am using the 10 period. Momentum is higher again today and the reading is stronger. This is a good sign for the market direction to continue to avoid prolonged weakness.
For MACD Histogram I am using the Fast Points set at 13, Slow Points at 26 and Smoothing at 9. MACD (Moving Averages Convergence / Divergence) issued a buy signal on Sep 9 which was confirmed on Sep 10. I had though we might see some sideways readings today but instead we have another strong reading of 4.23.
The Ultimate Oscillator settings are Period 1 is 5, Period 2 is 10, Period 3 is 15, Factor 1 is 4, Factor 2 is 2 and Factor 3 is 1. These are not the default settings but are the settings I use with the S&P 500 chart set for 1 to 3 months.
The Ultimate Oscillator is now overbought.
Rate Of Change is set for a 21 period. The rate of change is almost neutral again today. The reading needs to be stronger for the S&P to keep pushing up at the rate it has been. I would expect sideways action with some weakness for Thursday.
For the Slow Stochastic I use the K period of 14 and D period of 3. The Slow Stochastic is signaling that the market direction is up. It is overbought.
For the Fast Stochastic I use the K period of 20 and D period of 5. These are not default settings but settings I set for the 1 to 3 month S&P 500 chart when it is set for daily. The Fast Stochastic is indicating that the market direction is up and it too is overbought.
Market Direction Outlook And Strategy for Sept 12 2013
It has been a great recovery from the recent shallow correction but a number of indicators are getting quite overbought and the rate of change is not strong enough to push the market direction much higher.
For tomorrow I am expecting sideways action with some weakness during the day. We may end up higher but I do not believe it will be by very much. Any weakness though is simply a breather as all signals are pointing to higher prices to come. For now the 1680 level is the key to market direction. As long as it holds in any weakness, the market direction will then continue higher.
Market Direction Internal Links
Profiting From Understanding Market Direction (Articles Index)
Understanding Short-Term Signals
Market Direction Portfolio Trades (Members)

