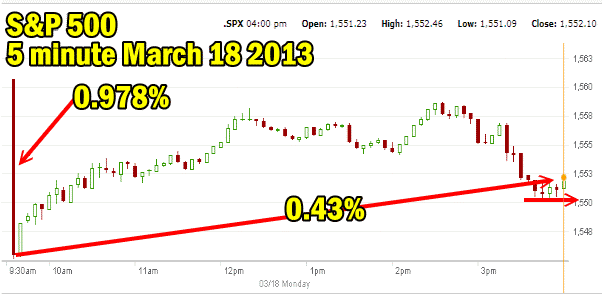
Market Direction today followed the pattern of a typical knee-jerk reaction on news that left investors concerned but not fearful. The market sold off right at the outset and the day was spent with the market direction clawing its way back as buyers looked at the selling as an opportunity to buy shares at slightly reduced prices. In the afternoon though the news that the vote in Cyprus had been delayed on whether to proceed with the levy on savings accounts rattled investors. It’s not that investors are in favor of this levy. Far from it actually as most believe it an outraged to tax savers. The problem is always the same, the uncertainty. Therefore the closing hour saw the gains cut in half as all three indexes fell into the close.
Market Direction Action For Today
The drop in the S&P 500 market direction this morning was almost a full percent. The close though saw the market trim the losses to just slightly more than 50%. At this stage of the rally from 1500 in the S&P 500 though, it is important to understand that there is not a lot of support in the S&P at present levels. The support is being provided solely by the investors who keep buying stocks on the dips in the market. If anything more serious should occur such as a spread of this issue to Greece and/or Italy then the retracement could be swift and bring the markets down where there is some support around 1500 to 1510. I am not expecting that however.

Market direction for March 18 2013 5 minute daily chart
Market Direction Closings
The S&P 500 closed at 1552.10 down 8.60 and the Dow closed at 14,452.06 down 62.05 points. The NASDAQ closed at 3237.59 down 11.48 points.
Market Direction Technical Indicators At The Close of Mar 18 2013
Let’s take a moment now and review the market direction technical indicators at today’s close on the S&P 500 and view the next trading day’s outlook.

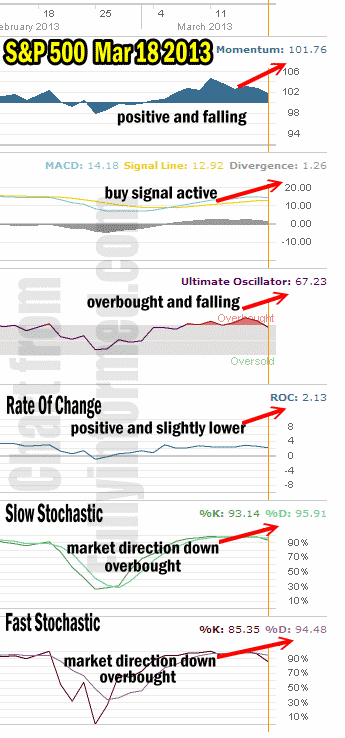
The Market Direction technical indicators took quite a hit from today’s action.
For Momentum I am using the 10 period. Momentum is still positive but because of the selling it has continued the slide from Friday. However it remains positive and that is important at this moment in the rally, especially after the selling today.
For MACD Histogram I am using the Fast Points set at 13, Slow Points at 26 and Smoothing at 9. MACD (Moving Averages Convergence / Divergence) is still positive and the buy signal remains active. Today’s selling turned the reading in MACD lower and narrowed the divergence. But it too remains positive at this point and again just like momentum it is important to the present rally.
The Ultimate Oscillator settings are Period 1 is 5, Period 2 is 10, Period 3 is 15, Factor 1 is 4, Factor 2 is 2 and Factor 3 is 1. These are not the default settings but are the settings I use with the S&P 500 chart set for 1 to 3 months.
The Ultimate Oscillator is still positive and overbought but pulling back. The movement lower in the Ultimate Oscillator is not a concern at this point and is to be expected because of the selling today. Nonetheless if we get another couple of days of falling prices the Ultimate Oscillator will turn negative.
Rate Of Change is set for a 21 period. Rate Of Change is still positive and despite today’s selling it remains only slightly down from Friday’s close. The sideways movement of the Rate Of Change indicates that in general investors are not concerned with the present rally and are “staying the course” as it were. That could easily change if investors get rattled again.
For the Slow Stochastic I use the K period of 14 and D period of 3. The Slow Stochastic is overbought and indicating clearly that valuations will be lower a few more days out. A sell signal was generated by the Slow Stochastic today..
For the Fast Stochastic I use the K period of 20 and D period of 5. These are not default settings but settings I set for the 1 to 3 month S&P 500 chart when it is set for daily. The Fast Stochastic is also overbought and it too is indicating that lower prices are to be expected for tomorrow. Meanwhile a sell signal was generated by the fast stochastic today as well.
Market Direction Outlook And Strategy for Mar 19 2013
The market direction outlook for Tuesday is for more weakness in the S&P 500. European and Asian markets were lower than US and Canadian markets. But the support within the markets at the present levels is not overly strong. As long as the Cyprus issue is quickly resolved without incident I would expect the rally to continue.
All the technical indicators are showing that the strength within the market direction is being tested but holding. The big drop at the open was immediately bought into by investors which is a bullish sign. Talk on the media outlets of an impending crash and others discussing a 10% drop in the markets I believe is wishful thinking on the part of bears. The market will need more than the present Cyprus crisis to derail the present rally. Rather than being concerned about an impending collapse I believe the right strategy is looking for opportunities to profit in this higher volatility.
For FullyInformed Members I sold my most recent calls from the VIX Index Strategy trade this morning although I am probably a bit early and better prices may be had tomorrow. That strategy can be viewed through this link. The May calls returned 19% for 6 days work and the July calls returned 7%.
I noted that Doug Harris with his market direction portfolio adjusted his position again today once before the markets opened and again during the day. FullyInformed Members might want to check out his comments for today.
As regular readers known my strategy has been cautious but invested. Now my strategy has changed and I am putting more capital to work. This sell-off may prove to be no more than a bump in the road but no matter whether it does or does not I will be committing more capital as I do not see any signs of impending collapse or any severe correction. Bull markets have corrections and they are almost always caused by a catalyst of some kind. Every such correction no matter how small is immediately pick up by doomsayers and the bears as a sign of the next coming collapse.
Turn down the noise, stay focused and look for opportunities. This type of market direction action is what creates those opportunities.
Internal Market Direction Links
Profiting From Understanding Market Direction (Articles Index)
Understanding Short-Term Signals
Market Direction Candlestick Daily View (Members only)
Market Direction Portfolio Ongoing Trades (Members only)
Market Direction External Links
