Market Direction is the most important aspect of investing. Even those who preach Buy and Hold as the only method for “true investors” are affected by market direction since almost all stocks are affected by overall market direction. Today I read with interest an article on seeking alpha where the author went to great lengths to prove historically the bull side for the market direction to continue higher and why the bear side of the argument has no merit at present. As some readers may recall I am not a bull or bear but prefer the wolf mentality when it comes to investing. You can read about my wolf attitude through this link. I really think the wolf should have been an official Wall Street mascot since I seek to profit no matter what the market direction is. I think wolves are terribly underrated.
Market Direction Manipulation
The thing about this author’s article on seeking alpha which you can read through this market direction link, is that statistics can be used to back up just about everything especially when it comes to investing. The seeking alpha article is exactly the same. In the article the author explains that he examined the price to earnings ratios and earnings yields for the S&P 500 going back to 1960 but he excluded 1974, 1977-1979, 1981, and 1997 through 2001 in calculation of average P/E because some of these years tended to skew the data upward and others downward. In other words the stats he presented are no longer factual but have been manipulated to prove the author’s outlook. This is obvious to anyone who reads the article. It is definitely obvious to those of us who have been investing for a long time that statistics are manipulated all the time.
Instead I like to recall the history of the stocks markets themselves to keep some semblance of understanding that markets gyrate and always will. I believe that stock market history can teach us a lot about market direction. Namely that mid to long-term no prediction is accurate. To that end let’s recall the 1970’s and 1980’s.
The Horrendous 1970’s Market Direction
1972 to 1978 were horrific years for investing. I had just started investing a couple of years before 1973 and had already lost half of my capital through a full service broker. When I left he advised me that “no one was making any money” because we were in a long-term secular bear market. We were in fact in a protracted bear market.
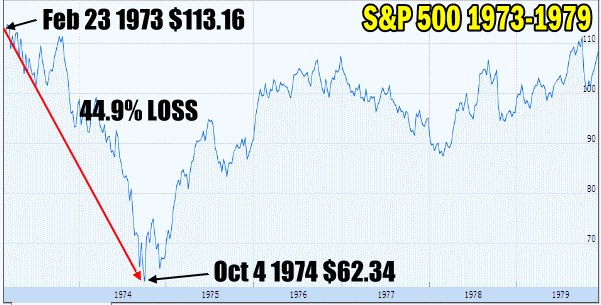
I found myself a mentor to teach me about investing and options, and had the misfortune of re-entering the market on Feb 23 1973 with the S&P at $113.16. By Feb 1973 the S&P was already down over 10% from its earlier peak and my new mentor felt pretty confident the worst was behind us. He was wrong as the worst lay ahead.
By October 1974 the S&P was down another 44.9% and headlines in newspapers (yes actual newsprint) were blaring headlines of the death of stocks, how investors were losing everything, pension plans were under pressure and the US economy was coming apart at the seams. Richard Nixon was President as the 1970’s started to unwind and by the time he was bombing North Vietnam to try to end America’s involvement in the war the US had spent almost 600 billion dollars on the war (in 2008 dollars). By 1974 Nixon resigned and Gerald Ford had become President. Ford presided over the worst recession since the 1930’s and indeed many economists called this recession the “Great Recession”. It was a horrendous time to be an investor, especially buy and hold, but it was a marvellous time for those of us who turned to margin and loaded up on stocks and over the counter call options.

Market Direction chart from 1973 to 1979
President Ford and Allan Greenspan
When Ford took over from Nixon in August 1974 the country was facing runaway price increases and market direction was down. I remember Ford introduced on national TV these round red lapel pins with the words WIN on them and encouraged everyone to wear them. WIN stood for “whip inflation now”. This of course did not work and he was ridiculed in the press for it. In 1974 the chairman of Ford’s Council of Economic Advisors was Allan Greenspan.
The 1970’s was a decade of rapidly increasing prices (prices rose faster than at any time in modern memory), high unemployment and stagnant economic growth. With GDP flat, unemployment at 9% and inflation at 12% economists today still call the 1970’s the worst period for trying to create any kind of lasting economic plan. At the outset Ford tried fiscal austerity which the Republican Party had been calling for to solve the problems. Ford was cutting federal spending, raising taxes and trying voluntary wage-price freezes. It was Allan Greenspan who convinced Ford that the real problems were unemployment and a stagnant economy not inflation.
Ford did an about face on the economy and increased spending and cut taxes to stimulate growth. The federal budget widened and congress worried. Ford vetoed a number of budget bills which attempted to limit government spending. By 1975 unemployment had dipped to about 7 percent and inflation was down to 4.8%. The GDP was finally picking up when Ford lost to President Carter and the oil embargoes of western powers by the Arab countries hit.
Skewing Market Direction Statistics
So in the seeking alpha article, you can imagine how removing some of these very tough years would skew statistics. Instead while statistics are nice, you shouldn’t remove years trying to prove a point, but instead look beyond the stats to what was happening at the time. The market direction was truly awful in the 1970’s but by the end of the decade in 1979, the market direction was actually higher than at the start of the decade. Not by much, but higher. Nonetheless the 1970’s became known as the lost decade.
Market Direction in the 1980s
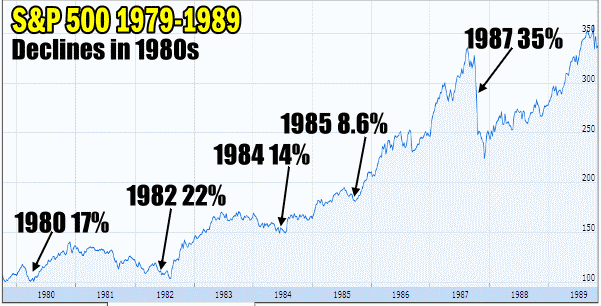
When I look back at the 1980’s I will not be at all surprised if what we see going forward in 2013 – 2014 is somewhat of a repeat of 1980 to 1982 in market direction. The market direction chart below shows the various declines throughout the 1980’s. If you look at the chart you can see that in 1982 by the time the market direction had declined 22% from its previous peak, it was basically back to where it was in 1980. I will not be at all surprised to find that market direction in 2013 moves up slightly more from where we are now and then sells down 5% to 10% into the summer months. Then the market direction will recover into the late fall and winter and sell-off in 2014 which may take the market direction back to about where we are now.

Market Direction declines in the 1980's
This of course is just a market direction prediction based on nothing more than my own outlook. But it’s nice to have a historical reference to look back at the past, remember some truly horrific periods and realize that as long as caution is exercised, applying proper trading strategies can earn excellent profits no matter what market direction environment we are in.
Market Direction 2013 Forward Outlook
What is become quite apparent to me is that the investing landscape itself has changed since the start of 2000. Today there are better products available with which to trade against market direction. For example in the market corrections of 1982, 1987, 1996, 1997, 1998 and 2000, there were not UltraShort ETFs available. As well since 2001 option liquidity has improved dramatically. There are today a variety of asset vehicles that can be used to profit from market swings both up and down. The introduction for example of the SPY ETF in 1993 changed forward the manner in which I hedged my overall portfolio against downturns and corrections.
In the years prior to 1993 it was far more difficult to garner the types of returns I have seen since 1993. In many of those years if I earned 25% in a year it was an amazing year. For example in the market direction correction of 1974 my portfolio had doubled by 1979. The downturn in 1987 returned 35% to my overall portfolio which I felt was spectacular.
However since 1993 my returns have improved thanks to all these new products. In 2000 to 2001 I more than doubled my overall portfolio. In 2008 I earned over 60% in returns and in 2009 my US portfolio jumped 113% as stocks recovered. In 2010 the return was 29%, in 2011 26% and in 2012 40%. This means that since January 2009 my portfolio is up 208% in 4 years. This is all due to the wider variety of products, the highly liquid options and the degrees of volatility which the stocks markets have been in.
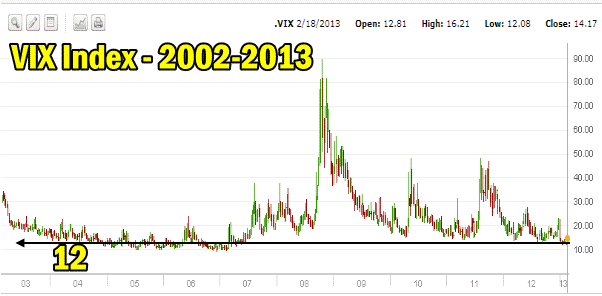
Looking at the VIX Index chart below for the past 10 years you can see how volatile the stock market has been and this has created higher option premiums and better trading returns.

Market Direction and VIX Index 2002 to 2013
Market Direction Outlook Longer-Term
Looking back at the market direction of the past decades in which I have been invested I must comment that rarely did the market direction mid to long-term ever follow what analysts believed. Those who sat on the fringes predicting gloom and those who predicted amazing heights were never right.
In the end, market direction is driven by fear. This past week’s sell-off was sparked in no small measure by the Fed policy minutes which mentioned stopping or slowing the latest round of quantitative easing. Yesterday’s strong bounce back was again primarily a result of the comments by James Bullard of the St. Louis Fed who advised he saw no quick end to quantitative easing.
So emotion drives the market. Fear is always with investors. Fear of missing a rally and fear of being caught in a downturn. There is no way that fear can be taken into statistics so instead consider that with today’s ever growing list of investing products, learning strategies that can take advantage of these products will go a long way to growing a portfolio much quicker than in the 1970’s, 80’s and even 90’s.
Learning proper strategies allows investors to stay invested for profit no matter what the market direction.
The increase in volatility which can whip stocks and cause market direction to fluctuate widely should be welcomed for the trading opportunities it provides.
Statistics will constantly be bantered about and quoted and argued, but overall consider staying with strategies that will protect your capital and compound it in any market direction because history has shown investors that no one can predict with certainty where we will be in even 2 months’ time. I just know that I want my portfolio to grow no matter what the market direction throws at me
Internal Market Direction Links
Profiting From Understanding Market Direction (Articles Index)
Understanding Short-Term Signals
Market Direction Candlestick Daily View (Members only)
Market Direction Portfolio Ongoing Trades (Members only)
Market Direction External Links
Market Direction IWM ETF Russell 2000 Fund Info
Market Direction SPY ETF 500 Fund Info
.
