Market Direction on the Dow and the S&P 500 has seen the markets climb in a grind higher over the past few trading sessions. The NASDAQ index has not always been following the same pattern and I have read a number of reports warning that the NASDAQ index market direction is warning investors that this rally cannot be sustained. Indeed as early as last night I read a number of articles that pointed to yesterday as a “key” bear reversal day signal.
Should investors worry then as the NASDAQ index might appear as no longer leading the market direction to new highs. After all the NASDAQ has led the market direction higher since the recovery from the bear market back in 2009.
Market Direction On The NASDAQ Is Positive
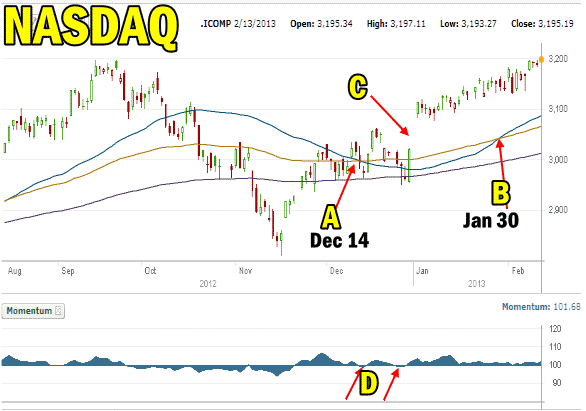
I fail to see the concern that many analysts and investors have been discussing with relation to the NASDAQ index. Below is the 6 month daily NASDAQ index market direction chart. While it may appear chopping when looking at the index monthly or weekly, when taken into context of a 6 month period you can see that the recovery in the NASDAQ index is well underway. In the chart below I have marked the key aspects.
A. The 50 day simple moving average (SMA) crossed down and over the 100 day exponential moving average (EMA) on Dec 14 signaling the market direction was changing to down.
B. That 50 day simple moving average (SMA) never crossed the 200 day exponential moving average (EMA) which would have signaled a strong sell signal. Instead the 50 day continued lower and then turned back up, finally crossing the 100 day EMA on Jan 30 signaling that the market direction on the NASDAQ index was back to up.
C. This large gap occurred is from Dec 31 when the market closed at 3019.51 and then on Jan 2 opened up at 3091.33. This is a large gap open which almost always will at some point be closed. This could be the level to watch later this year when a correction occurs in the market direction.
D. Throughout this period you can see that momentum was only slightly negative twice and for a very brief period. The rest of the time momentum has been positive which supports the market direction in the NASDAQ as being higher.

Market Direction NASDAQ INDEX 6 months daily chart
Apple Stock and NASDAQ Market Direction
Part of the problem for the tech laden NASDAQ index is Apple Stock which heavily overweighted the index and could easily skewer the movements as Apple Stock has taken a severe beating starting towards the end of September 2012. Another stock that has hurt the NASDAQ Index was Intel Stock which also fell over 25%. These two companies have stymied the rise in the NASDAQ. Indeed market direction would be a lot higher is both of these stocks had not seen such dramatic sell-offs as investors worry about the technology sector in general.
Financial Sector Could Be Back Leading Market Direction Higher
However sectors rotate often in stock markets and when the credit crisis hit the market direction back in 2008 to 2009, the technology sector staged the recovery effort in the Spring of 2009 rather than the financials. In many of the bull markets of the past, the financial sectors led market direction higher. The collapse in 2008-09 being financial in nature has meant almost 5 years of the financial sector failing to lead.
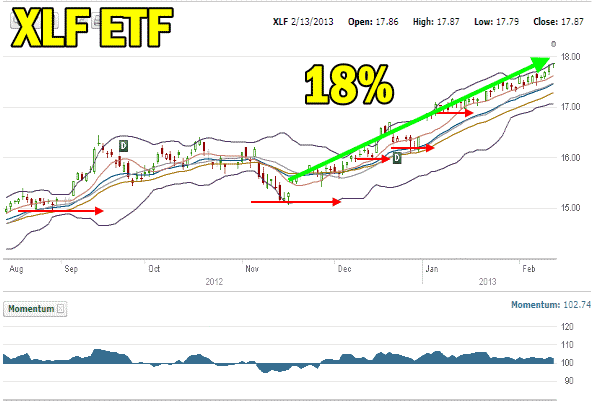
That may have now changed as technology is having a tough time. The XLF ETF is an excellent financial sector ETF to watch for financial stocks and the market direction in general. The 6 month daily XLF ETF chart is below and it seems likely that the financial services industry is back leading the market direction once again. Since the lows of November the XLF is up 18% and setting new 5 year highs. While still down 50% from the highs of May 2007, the XLF ETF is showing a pattern of higher lows as it continues to recover. Meanwhile momentum has been strongly positive since November 2012, another bullish indicator that the financial sector may have finally recovered from the vicious bear market which saw stocks like Citigroup Stock fall below $1.00.

the XLF ETF is showing signs that the financial sector is back leading the market direction higher.
Market Direction Outlook For The NASDAQ Index
The market direction outlook for the NASDAQ Index I believe remains positive. While it may no longer be leading the market direction, the NASDAQ is participating in the rise and continues to set new 5 year highs. Instead too many analysts are reading far too much into the market direction of the NASDAQ index. Being overweight specific stocks is a distinct problem that can hinder the true underlying currents of the true market direction. Right now market direction continues to point to higher markets and higher valuations for most stocks. While not leading any longer, the NASDAQ is still along for the ride but to believe that it is signaling market direction down I think is not only premature, but incorrect.
Internal Market Direction Links
Profiting From Understanding Market Direction (Articles Index)
Understanding Short-Term Signals
Market Direction Candlestick Daily View (Members only)
Market Direction Portfolio Ongoing Trades (Members only)
