Market Direction on Friday continued the move lower but at a much smaller pace on declining volume, which is normal for this time of year. The most important market direction indicator on Friday was not so much the technical indicators as the resumption of the sell-off in Apple Stock. As Apple Stock is now down to its lowest level in 10 months many analysts are calling this the single most important indication that the stock market direction higher is in trouble.
I cannot decide if I am in agreement. The somewhat lacklustre introduction of the iPhone5 along with news that it was being discounted in Walmart Stores and elsewhere combined with discounted sales on the iPad2 and 4 and now the iPad mini at some locations is concerning a lot of investors. Could the decline in Apple Stock be advising us not so much that the stock markets are in trouble as that Apple Stock was overvalued by most analysts and many investors. Institutional investors are not really any smarter than retail investors. Often they have the same amount of information in front of them to review and many institutional investors bought into Apple Stock above $550. Watching CNBC on Friday as Apple Stock continued to fall, some analysts were interviewed, each one trying to speaking convincingly that Apple Stock is tremendous value at these prices and shortly the stock will be at $1000 and higher. They could be right, but the level of concern was easy to see in their faces.
Market Direction and Apple Stock
The selling in Apple Stock is continuing to be a detriment to the NASDAQ and does worry many investors. But there was also good news on Friday as the inflation rate fell to 1.8 percent in November which was below expectations and certainly gives the Fed lots of room for further liquidity. Chinese manufacturing data showed a growing strength in China as it rose to 50.9, a 14 month high and a sign of an expanding economy again. As well US Industrial Production was up 1.1 percent, above expectations. The news out of China and the USA help spur commodities stocks and some commodities. Gold though is continuing to show signs of weakness.
Market Direction and S&P 500 Stop-Loss
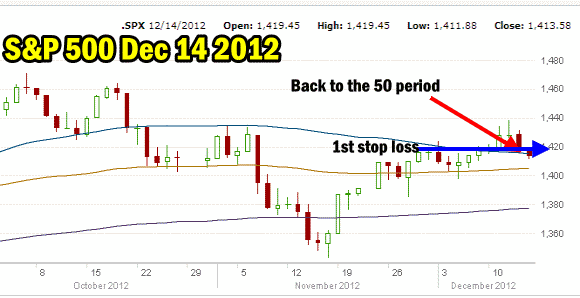
On Friday the S&P 500 market direction fell back to the 50 period moving average. If you recall my article from earlier this week on using the S&P 500 as a guideline for stop-loss on portfolios, on Friday the S&P 500 was at the first stop around the 1415 level.

Market Direction for December 14 2012 shows the 50 period moving average is being retested.
S&P 500 Stop-Loss
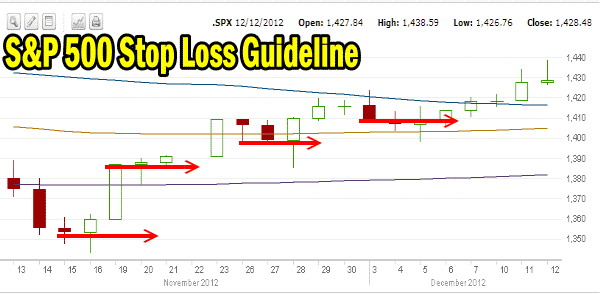
In my article looking at using the S&P 500 as a stop-loss for a portfolio, at the first stop-loss if on Monday the market continues to move lower it becomes time to buy a bit of protection for that “just in case” scenario for investors who are concerned. This first stop-loss could be anything from the DXD or SDS to the bear HEDGE Fund HDGE. Whatever is chosen, investors could also consider taking profits in positions and sell out to raise cash. If stocks continue to fall investors will be able to buy back these same stocks at lower prices. Another strategy is in the money covered calls. I covered that concept in this article on my members site on how deep in the money covered calls can save your capital.

Using the S&P market direction as a stop-loss for profit taking in the event of a decline.
There are many strategies which investors can use if on Monday stocks continue to move lower. While I am not expecting much of a decline, things can always change quickly in the stock markets. Having some protection is never a bad idea.
If the decline continues in the stock market each of the above price valuations can be used as a guideline for when to continue to put on protection, sell profitable positions, or sell in the money covered calls. Should the decline become steeper, an investor can use the above price levels in the S&P 500 to determine when to increase the size of protective positions.
Market Direction Technical Analysis for Dec 14 2012

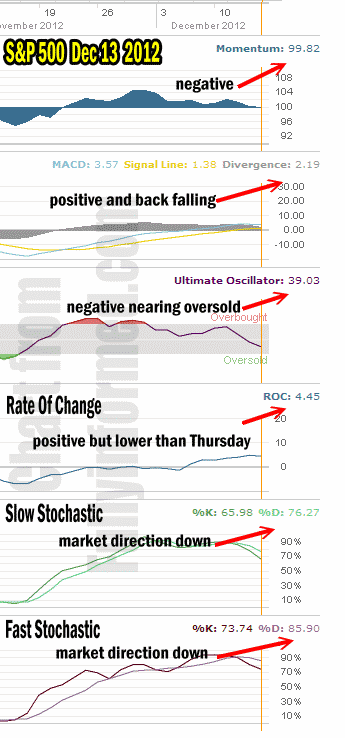
market direction technical analysis Dec 14 2012
For Momentum I am using the 10 period. Momentum is now negative after the close on Friday.
For MACD Histogram I am using the Fast Points set at 13, Slow Points at 26 and Smoothing at 9. MACD (Moving Averages Convergence / Divergence) is still positive but is back declining.
The Ultimate Oscillator settings are Period 1 is 5, Period 2 is 10, Period 3 is 15, Factor 1 is 4, Factor 2 is 2 and Factor 3 is 1. These are not the default settings but are the settings I use with the S&P 500 chart set for 1 to 3 months.
The Ultimate Oscillator is still negative and is continuing to fall. It is now nearing oversold.
Rate Of Change is set for a 21 period. Rate Of Change is still positive and is down just slightly from the previous day.
For the Slow Stochastic I use the K period of 14 and D period of 3. The Slow Stochastic is no longer overbought and is indicating that the market direction down will continue for a few more trading sessions.
For the Fast Stochastic I use the K period of 20 and D period of 5. These are not default settings but settings I set for the 1 to 3 month S&P 500 chart when it is set for daily. The Fast Stochastic is also indicating market down for Monday.
Market Direction Outlook And Strategy
The market direction outlook for the start of the week is for more weakness in the markets unless a catalyst can be found to push market direction back higher. That catalyst could be any news supporting a resolution to the fiscal cliff. Aside from that, the markets are not heavily oversold and as such many technical indicators are continuing to reflect the present weakness in stocks. Market direction then is still lower.
I must point out that while the short-term market timing indicators are pointing to a market direction down, I believe that a technical break-out that occurred just prior to Friday is a significant event and a signal that the overall market direction is higher. But this will not happen overnight and a retesting of support is to be expected. While the market technical indicators are showing a decline to continue for Monday, I am continuing to look for Put Selling opportunities and doing the Trading For Pennies Strategy as I believe this selling is a dip and nothing more.
That said, the market direction timing indicators are not of the same opinion as me and are pointing to more short-term weakness to start the third week of December. Remember though that now the market direction is entering the Santa Claus rally period and the markets could surprise to the upside.
Internal Market Direction Links
