While not as wild a day as yesterday, the markets continue to show the concern investors have over the fiscal cliff issue. Today the market direction opened up and by 11:30 started to sell off as House Speaker Boehner who yesterday was update on talks, said there was no substantive progress. A short while later the market direction recovered, when Senator Schumer said there had been progress and White House Spokesman Jay Carney said the Obama administrative was optimistic.
Three things are weighing on market direction. There is resistance of sellers as the markets climb back toward the 50 period moving average on each index. There is also a very overbought condition but most of the problem for market direction moving higher is investor fear over whether Washington is making any kind of progress at all on the fiscal cliff dilemma.
Today the S&P 500 closed at 1415.95, up 6.02 points or 0.4 percent and the Dow closed at 13,021.82, up 36.71 points or 0.3 percent while the NASDAQ closed higher at 3012.03, up 20.25 points or 0.68 percent. Today the NASDAQ closed back above the 3000 level.
On the economic front there was also the news of U.S. initial jobless claims falling to 393,000, down from 416,000 in the previous week. Regular readers will recall my recent article on the market timing system using the weekly unemployment initial claims. You can read that article here. Falling numbers should help the market direction move higher.
As well the U.S. economy expanded at an annual rate of 2.7 percent which is revised higher after an initial figure of 2 percent was released weeks earlier. 2.7% is nothing great, but it does show that the economy continues to expand, although very slowly.
The Market Close Today
Technically all the markets closed with a bit of selling into the close. The amount of selling was minimal but it kept all the indexes from closing on their highs for the day. While certainly not a bearish sign, it is a bit troubling and shows that confidence continues to be a very real problem for investors.
Market Timing Technical Indicators
While still pointing to market direction moving higher, the market timing indicators are also showing signs of weariness.
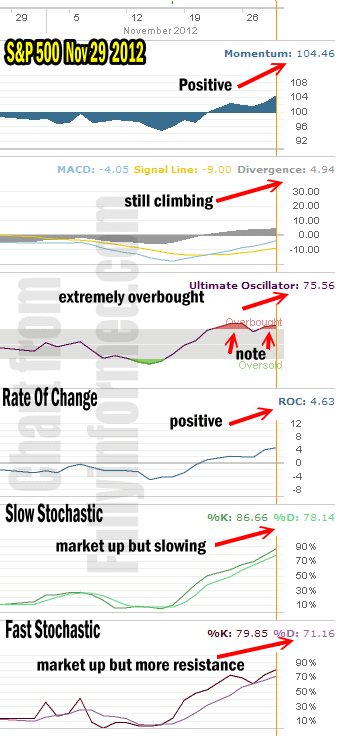
For Momentum I am using the 10 period. Momentum is one of the bright spots today with further solid readings from yesterday. Momentum still shows that the overall trend is for market direction to move higher.
For MACD Histogram I am using the Fast Points set at 13, Slow Points at 26 and Smoothing at 9. MACD (Moving Averages Convergence / Divergence) is up slightly from yesterday. Still positive, MACD’s climb is slowing.
The Ultimate Oscillator settings are Period 1 is 5, Period 2 is 10, Period 3 is 15, Factor 1 is 4, Factor 2 is 2 and Factor 3 is 1. These are not the default settings but are the settings I use with the S&P 500 chart set for 1 to 3 months.
The Ultimate Oscillator is still positive but if you look at the last two extremely overbought signals, note how this most recent signal is not nearly as strong as the previous one. This is a signal that while there are still buyers, they are taking their time entering trades and are not chasing stocks higher now.
Rate Of Change is set for a 10 period. Rate Of Change is still climbing and is higher than yesterday but like the Momentum indicator it is not nearly as big a move up today again showing signs of weariness as the market direction up starts to slow.
For the Slow Stochastic I use the K period of 14 and D period of 3. The Slow Stochastic is overbought but the readings between the K period and D period are close enough that while still bullish, the trend could be starting to change to sideways.
For the Fast Stochastic I use the K period of 20 and D period of 5. These are not default settings but settings I set for the 1 to 3 month S&P 500 chart when it is set for daily. The Fast Stochastic is confirming the Slow Stochastic signal. While slightly more bullish for tomorrow, the Fast Stochastic readings are also showing signs of the market direction rise, slowing. While not showing typical topping action, they are definitely signaling that the push higher from here may be a lot slower.

Market technical indicators show market direction up is overbought and slowing
S&P 500 Market Timing Technical Summary
The rise has been decent although certainly filled with lots of whip saws and uncertainty. The consensus remains for the market direction to move higher, but generally the market timing tools are also showing that the market direction outlook is for a lot more resistance to the market rising quickly from here.
Market Direction Chart of S&P 500
Let’s look at the S&P 500 chart. Today the S&P is reaching for the 50 period moving average.
A) If you look carefully at the chart you can clearly see that the 50 period has turned and is moving lower. This is not a problem but if the market starts to trend sideways the 50 period may fall lower and cross the 100 period (yellow line). This will be a clear signal that the latest rally has topped out so it will be something to keep an eye on.
B) The Lower Bollinger Band has flattened out. This is noticeable on all three indexes and again is nothing for concern at this point but the Bollinger Bands may move toward a Squeeze which I described in my Bollinger Band Strategy article on the members site here. A squeeze could be starting to develop. The market really needs to get up to the Upper Bollinger Band to confirm that the market direction is confirmed as back up. That is still not happening which is why this rally remains very suspect, which tells me as a put seller to be careful to stay out of the money when selling puts as I may end up being assigned should this market turn around and fall back again.
If the market direction does turn back down, there will be some heavier days as investors who bought in recently will be dumping their shares to get out in a hurry.

Market Direction Nov 29 2012
Market Direction On The NASDAQ
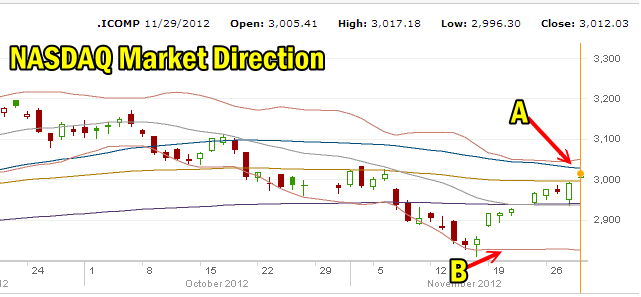
Just before ending this review of market direction for tonight. Let’s look at the NASDAQ index which today closed back above the 3000 level.
A) The down turn in the 50 period moving average is even more pronounced in the NASDAQ index. The span between the 50 period and 100 period moving averages is not very wide as the 50 period is reflecting the recent decline in the NASDAQ which was more pronounced than the other indexes thanks to the likes of Apple Stock, Intel Stock, AMD Stock and many others. Again the same technical concern arises should the 50 period cross over the 100 period moving average signaling an end to the recent market direction rally.
B) The Lower Bollinger Band is flat just like the other indexes. At this stage nothing to be concerned about but it bears watching. It would be better if the Lower Bollinger Band was moving higher to reflect strength in the upturn. This is not happening in any of the indexes thereby making this latest rally very suspect as nothing more than a “dead cat” bounce.

NASDAQ Market Direction for Nov 29 2012
Market Direction Outlook And Strategy
Tomorrow is the last day of November. Black Friday and Cyber Monday are over and the market indexes are somewhat higher but certainly not setting any convincing records. For investors who follow candlestick chart analysis, the close today issued a buy signal on the S&P 500 and the Dow Jones Index. The NASDAQ index had a buy signal issued on November 19 which remains valid.
Market Direction then for the last day of November is for tomorrow to see a sideways trending market as this rally is tiring, but the bias is still to the upside.
Internal Market Direction Links
