In July 2012 I wrote about a unique market timing system for assisting in predicting overall stock market direction. That market timing system was the Initial Unemployment Insurance Claims. You can read the original strategy article by selecting this link.
By following that market timing system I know that when initial unemployment insurance claims rise the stock market can become more unstable and market direction can change from up to down. As well volatility as measured by the VIX Index normally will rise. All of these changes can happen almost overnight.
I have tracked this market timing system using Initial Unemployment Insurance Claims for better than 10 years and it is rare when it fails.
That’s not to say the market falls apart or there are big pullbacks. That’s not the case, although if initial unemployment insurance claims keep rising each week as they did in 2008, 2006, and 2002, stock market direction continues to pullback weekly.
The important aspect of keeping an eye on the weekly initial unemployment insurance claims is for Put Selling opportunities. When the initial unemployment insurance claims climb weekly, volatility moves higher and pushes up put option premiums that I like to sell. This is only natural as most stocks tend to follow the market direction. Once the market direction changes to down after a weekly initial unemployment insurance claims announcement of an increase in claims, a lot of my favorite stocks fall and I can place sell offers at a variety of put strikes and normally grab some better put premiums.
This market timing strategy has worked very well this year because the initial unemployment insurance claims numbers are fluctuating as the recovery is slow to create a lot of jobs which means spikes in weekly initial unemployment insurance claims filed which jumps volatility and put premiums.
With the end of 2012 a month away, let’s look at the likelihood that the market direction could continue higher based on weekly initial unemployment insurance claims statistics.
Weekly Initial Unemployment Claims Market Timing System
Market Direction Review of 2012
Below are the weekly initial unemployment insurance claims statistics.
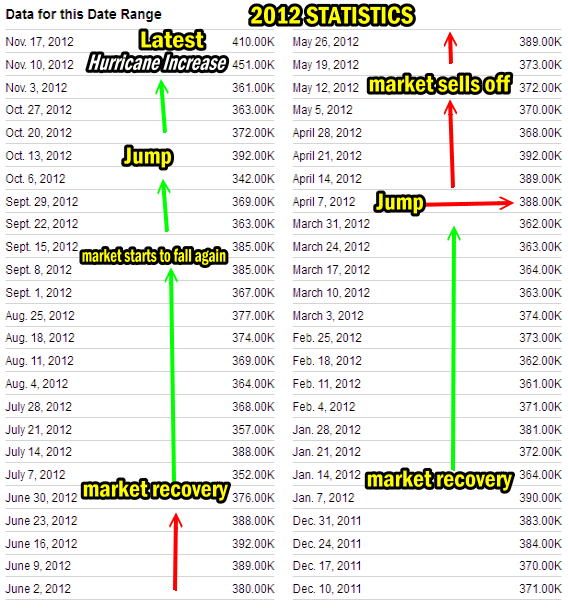
2012 Weekly initial unemployment insurance claims
You can see how at the start of Jan claims were up to 390,000 and the next week they fell to 364,000. The week of April 7 saw a spike back to 388,000. Now look at the stock market direction chart for this same period.
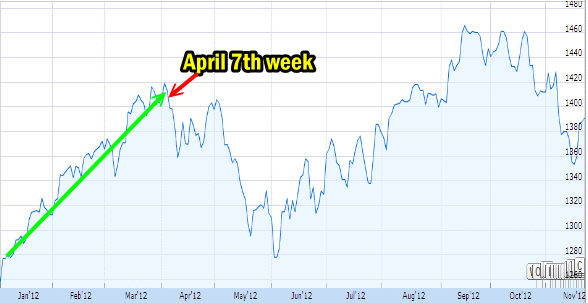
Market Direction To Top In April 2012
You can see the rise in the market until the week of April 7th. Then the market commenced selling until bottoming in the first week of June.
VIX Index Chart
The VIX Index Chart shows the same pattern. From January the VIX Index pulled back until March 26 and then the first week of April as the weekly initial unemployment insurance claims rose, the VIX Index started to climb and by the end of May to the start of June it had reached above 26, which as of November 21 2012 have been the highest level reached this year.
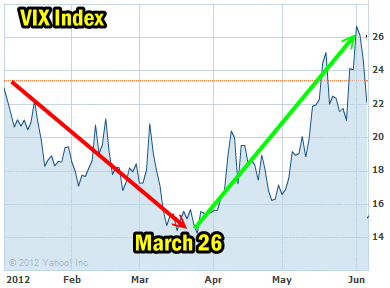
VIX Index Index Chart To June 2012
Put Selling against weekly initial unemployment insurance claims
This fits in quite well with Put Selling as a major investment strategy. As volatility rises and the market direction falls, put premiums climb making Put Selling more profitable. It also means I am Put Selling stocks at lower prices and not higher prices.
Not all stocks of course will follow the trend up and down. Some stocks manage to hang on when the market direction changes. But eventually almost all stocks will experience weakness as the market direction continues lower simple because investor psychology has a hard time hanging on in the face of a declining stock market.
Yum Stock Example
For example YUM Stock this year has been very profitable for my Put Selling strategy. You can view all the Yum Stock trades for this year through this link. Yum Stock has pretty followed the market direction this year which also means it is following the market timing system in use. This has meant I have not been Put Selling at high strike prices. Instead when the market direction changes and pulls back I am selling my put strikes at the lower valuations.
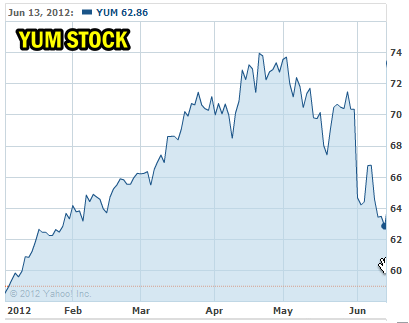
Yum Stock first half of 2012
No Market Timing System is Fool Proof
No market timing system is fool proof, but after 10 years I have found following the weekly initial unemployment insurance claims timing quite good, especially for picking when to go back to Put Selling and when to stop.
Present Correction
In the present correction I raised a lot of cash and I have applied quite a bit of it back into the market. I also rolled many put positions lower and many expired with November options expiry. So should I apply more capital into naked puts or what is the weekly initial unemployment insurance claims market timing system advising?
The jump in September in weekly initial unemployment insurance claims to above 380,000 stalled the market direction recovery and turned the market lower. The recent Hurricane increased those claims even more which was reflected in the Nov 10 claims of 451,000 (revised lower after initially reported at 491,000) which also saw the market turn sharply lower.
You can see this in all the indexes including the Dow Jones below. So while the media is filled with the fiscal cliff dilemma, there are always other factors at play and the jump in weekly initial unemployment insurance claims was followed immediately by the markets dropping.
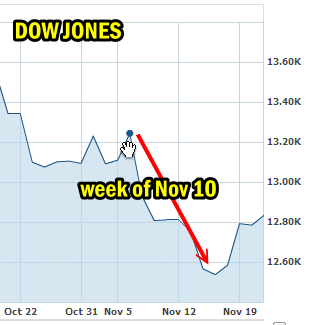
Market Direction turned sharply lower the week of Nov 10
Outlook For Market Direction
The past week’s initial unemployment insurance claims fell by 41,000 falling back to 410,000 which is still high. Next week though the claims should be lower still. Once the weekly initial unemployment insurance claims fall back below 380,000 the market direction has a good chance of climbing or at least holding onto into the fiscal cliff fight between Congress and the President.
It Pays Well To Watch This Market Timing System
It pays quite well to keep an eye on the weekly initial unemployment insurance claims and use this market timing system to pick the times to engage in Put Selling. Even stocks that do not fall with the market are still under pressure when the market direction turns down which increases put option premiums. That means using the weekly initial unemployment insurance claims market timing system holds importance for all stocks and ETFs.
This is a very simple market timing system that every investor can use to their advantage whether they are Put Selling like me, or want to time buying stocks for another run higher in the indexes and right now the decline in claims is signaling a move back up in market direction.
