The market direction today was not overly encouraging. One would expect a bounce after such a drop but instead the market direction treaded water for most of the day until later in the afternoon. The stock markets are sitting at critical levels but the NASDAQ may already be leading the Dow and S&P 500 market direction lower.
Today’s Market Direction Action
The S&P had a small rally to start the day and then sold off the rest of the day closing near the lows for the day. Looking at the market direction for the past few trading sessions you can see how back on Oct 12 and 15 the 50 day was tested and market direction bounced off of it. But the rally back left the market with a lower high and MACD did not confirm any move back up. Since then it has been all downhill. The 50 day was easily broken on the second attempt and following that the market direction has taken us all the way to the 100 day. Today we closed pretty well on the 100 day.
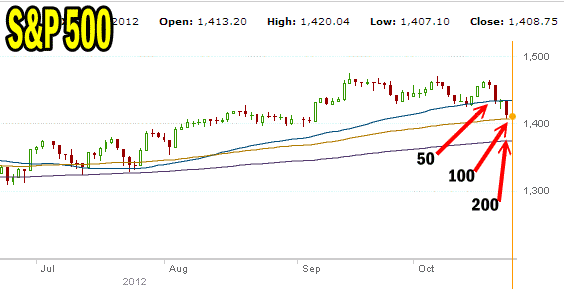
Market Direction on the S&P 500 for Oct 24 2012
There should be some support just below us as this moves the market back into the support from August to September. This could provide a day or two of less volatility and possibly a small bounce. Following that the next level of support is at the 200 day moving average around 1370 which also extends from the summer period. The problem is both of these levels is soft support.
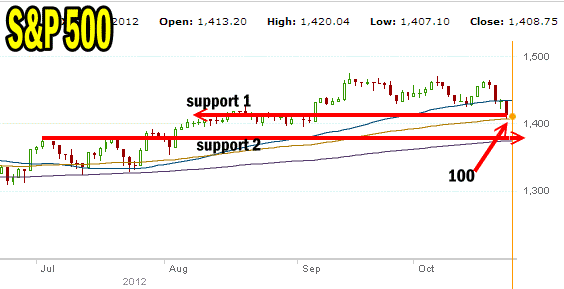
Support for the market direction pullback for the S&P 500
In order for the stock market to push back up investors have to be convinced that stocks are worth more than at present valuations. That will be a tough sell. Therefore it becomes a question of what are stocks worth and where is that level in the S&P 500. To get stocks back to fair value could mean a move down to 1280 to 1300. This is the lows of this summer and if you look at the 2011 to 2012 market direction chart below you can see that the 1280 to 1300 level has a fair amount of support. On the chart it looks like a steep fall but from where we are today it is just 9% lower.
Right now the S&P is down about 4.4% so 9% lower would mean a drop of 13.4% which is not bear market country. If the 1st level of support breaks then the next level if almost 100 points lower at 1180 to 1190. This would be the line in the sand. It would mark a 19% to 20% correction and place the bull market on the brink of turning into a bear market.
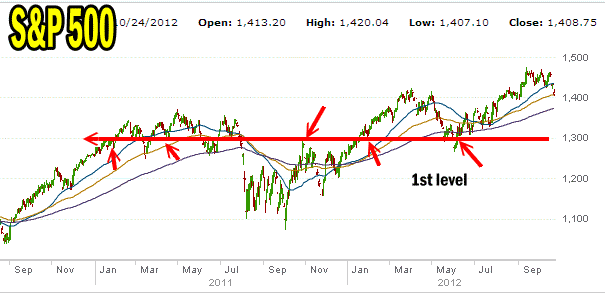
First level of strong support is probably around 1280 - 1300
Back To The 100 Day EMA
But that’s way ahead of ourselves as today we are flirting with the 100 day moving average. These long-term moving averages, 50, 100 and 200 are often dismissed in the media until the market direction hits a bump and then the media suddenly “rediscovers” them. But they are technically very important markers for the stock markets as the majority of investors tend to trade around these indexes. Once broken a lot of investors begin to move to the sidelines.
NASDAQ Market Direction
Another problem for the market direction is the NASDAQ which is now on the verge of breaking its 200 day moving average. About the only bright spot was the intraday low from yesterday of 2974.07 was not breached today at all. This is showing some of the strength of the 200 day moving average. The 200 day holds a lot of longer term investors. When it breaks a lot of investors will move to the sidelines. The NASDAQ led the market recovery from 2009. It would appear that since Sept 21, it has led the sell-off.
On Sept 26 MACD issued a sell signal on the NASDAQ which has not been broken. The sell signal today at the close is a very bearish negative 13.03. The NASDAQ Slow Stochastic and Fast Stochastic indicators are extremely oversold which could help with a market direction bounce.
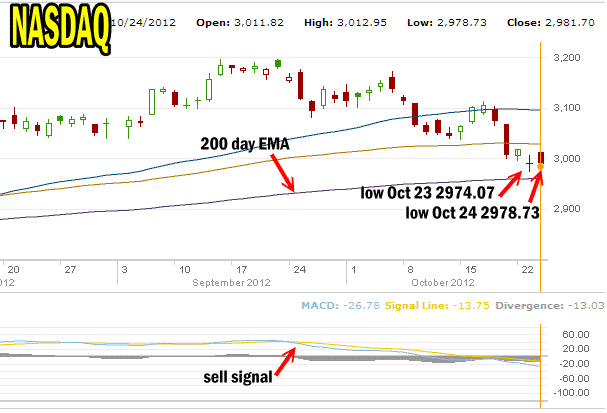
Market Direction for the NASDAQ has been down since its most recent high Sep 21
Apple Stock and Market Direction
Tomorrow Apple will release its earnings and even if they are good, investor sentiment is overwhelming negative. So while Apple Stock could lead a short-term market direction bounce in the NASDAQ index, looking at the chart above, can you imagine this sell-off turning right around from here? Hardly seems likely.
Market Timing Technical Indicators for Wed Oct 24
The market direction as determined by the S&P 500 market timing indicators at the close of trading were still decidedly bearish.
Momentum is lower and MACD is more bearish than yesterday and continues with a solid sell signal.
The Ultimate Oscillator is entering oversold as soon as it hits 30. It is almost there today.
Rate of change is a solidly negative.
The Slow Stochastic is oversold and remains bearish.
The Fast Stochastic is extremely oversold and bearish but we could get a market direction bounce off such a solid oversold reading. But I will be ignoring and bounce and using it to Buy To Close (BTC) and roll naked puts.
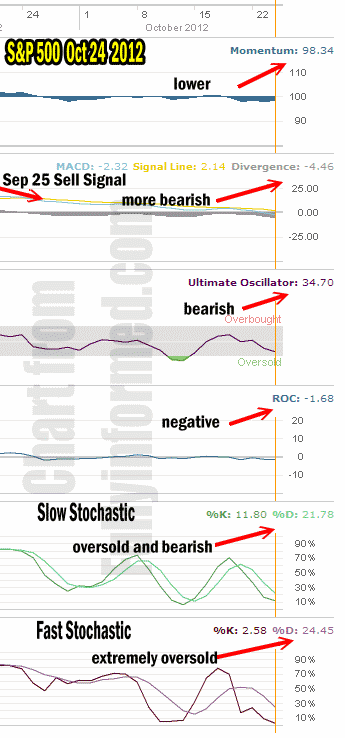
Market Timing Technical Indicators for Oct 24 2012
Market Direction Outlook
The market direction remains down although there are enough signs of being so oversold that a bounce could be expected if not Thursday certainly by Friday although when market direction is down, Friday’s tend to be poor because investors do not want to hold positions over the weekend.
Longer-term though the charts above show what the market is up against. The many analysts who are calling for this market to recover the lost ground are out of touch at this time. The market pullback is strengthening not weakening based on volume and the number of declining stocks which outweigh the advancing ones. Markets have actually been in decline for almost a month since MACD (Moving Average Convergence / Divergence) issued the sell signals on all the markets back in late September. Since then it has been downhill and market direction remains solidly with the bears. In order for market direction to regain the recent highs investors must have confidence that stocks are worth higher price to earnings and price to sales. Right now the majority of stocks are over-valued but are starting to return to fair value.
Once stocks reach fair value a bottom will depend on investors deciding whether they feel stocks are fairly valued, else market direction will continue lower until investors are back buying again.
This evening in the Member Section I have started a new category, “Corrections and Bears” in which over the coming days I will be posting articles dealing with handling corrections for both profit and protection. I hope Members will ask questions and offer their own methods for surviving a market direction pull back. Let’s hope we can all profit from what is presently a market direction correction.
